Entire Set of Printable Figures For
Exemplar Memory and Discrimination - Chase & Heinemann
![]()
Footnote 1. From a very different perspective, investigators such as Estes (1994, Hintzman (1988) and Nosofsky (1991), have developed exemplar models of categorization of visual stimuli by human participants that have much in common with NIM.
![]()
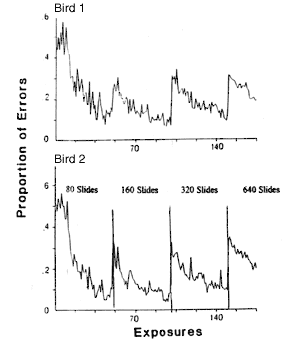
Figure 1. Rote memory categorization experiment by Heinemann, Ionescu, Stevens and Neiderbach. The pictures were randomly assigned to two categories without a unifying “concept” on which key choice could be based. Sessions were 80 trials in length with the pictures presented in a different random order within each session. Training began with 80 pictures. When errors fell below a proportion of 0.15 the number of pictures in the set was increased to 160, then to 320 and finally to 640. The final set of 640 pictures required eight sessions for a single exposure.
![]()
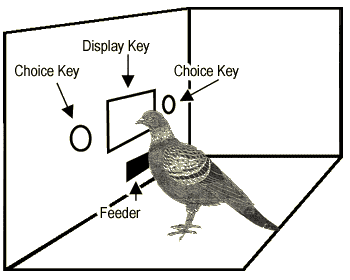
Figure 2. The apparatus used in a choice experiment.
![]()
Figure 3. The proportion of responses to the key designated “correct” for the less intense of the two stimuli. The solid lines show the proportion of correct responses (hits) and the dotted lines show the proportion of incorrect responses (false alarms). Training is shown as a function 80 trial sessions (from Heinemann, 1983b).
![]()
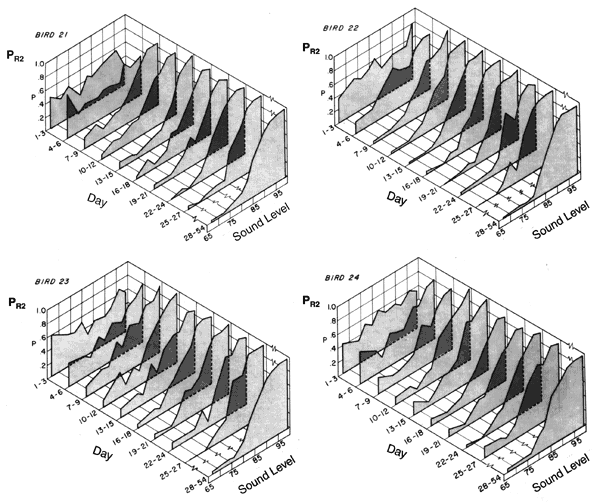
Figure 4. Proportion of responses to the high intensity key, R2, as a function of sound intensity. The functions are averaged over three sessions of training except for those showing asymptotic performance (days 28-54).
![]()
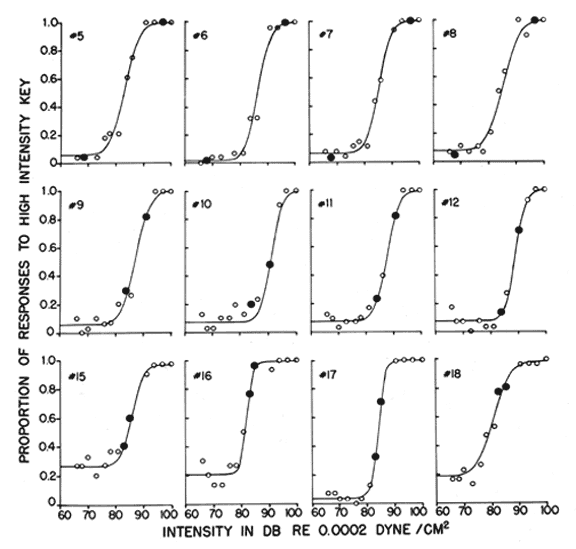
Figure 5. Results of a generalization test for birds that were trained to discriminate between two sound intensities. The proportions of responses to the high intensity key, R2, are shown as a function of sound intensity. The solid dots are the proportions for the stimuli used in training. The open dots are the proportions for the generalization test stimuli. The smooth curves fitted to the data are based on our signal detection analysis of these data (see Heinemann et al., 1969).
![]()
Figure 6. Results of a generalization test given to birds trained to discriminate between two light-sound compounds. The dimmer light and softer sound were correct for R1. The brighter light and louder sound were correct for R2. The top panel shows results obtained from birds that were trained with the smaller light intensity difference. The bottom panel is for birds trained with the larger light intensity difference. For all birds the sound intensity difference was 35 dB.
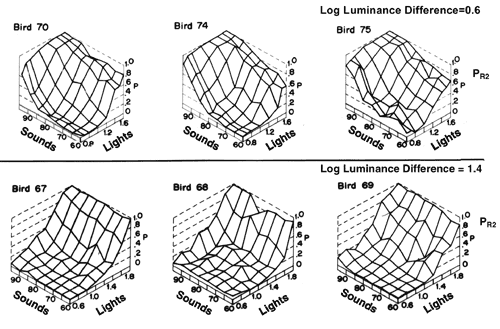
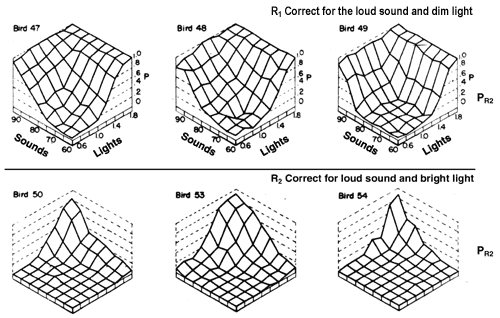
Figure 7. Results of a generalization test for birds that were trained to discriminate between four light-sound compounds. The proportion of R2 responses is plotted for each of the 64 test stimuli. The top panel is for birds trained with R1 correct only in the presence of the soft sound, dim light compound (R2 was correct in the presence of the other three compounds). The bottom panel is for birds trained with R2 correct only in the presence of the loud sound accompanied by the bright light (R1 was correct in the presence of the other three compounds).
![]()
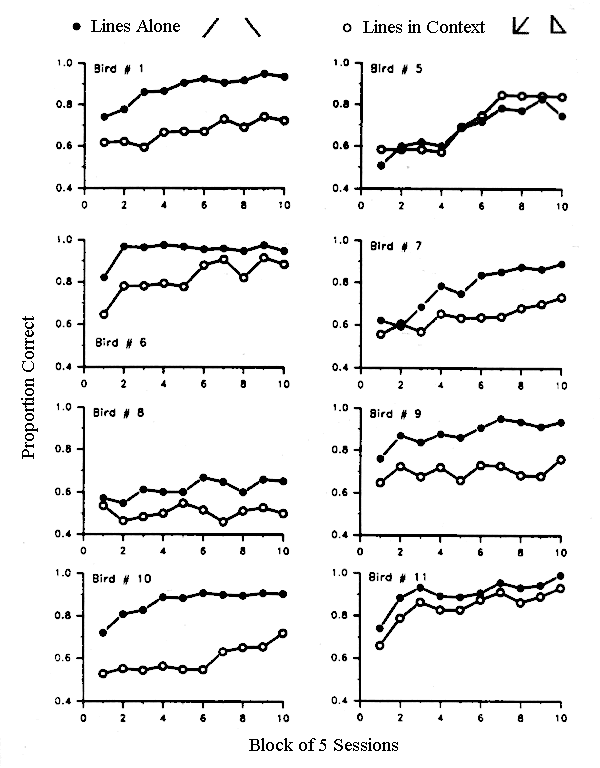
Figure 9. Learning curves for each of the eight pigeons in Donis and Heinemann (1993, Experiment 1).
![]()
Footnote 2. Absolute identification of lights varying only in intensity showed that differences in the number of records held in working memory is primarily responsible for the differences among these species. Simulations yielded an estimated sample size of 6 for pigeons, 10 for monkeys and 16 for humans (Chase, 1989).
![]()
Footnote 3. This definition of an “uninformative sample” is tentative. We have not systematically explored its effects. However, it appears that the simulations are insensitive to exactly how “uninformative” is defined.
![]()
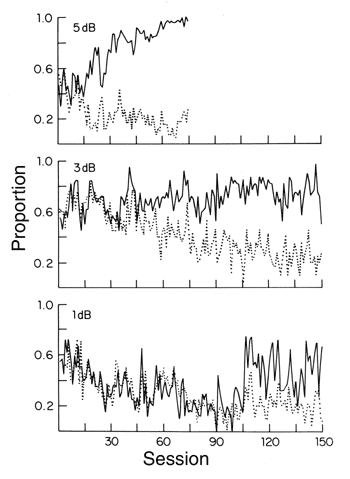
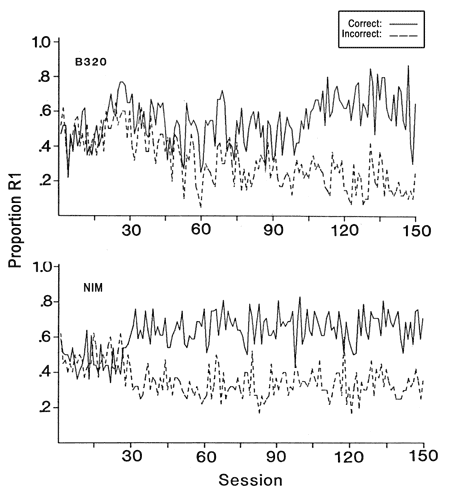
Figure 17. Acquition curves are shown for a pigeon who was trained on a 3 dB sound intensity difference for 150 sessions (top panel) and a simulated pigeon (bottom panel). For the simulated pigeon the size of XM was 1200 records, the number of records in working memory was 10 and d' was 1.0. These data are from Heinemann (1983b).
![]()
Footnote 4. It is quite likely that the motivational state of the organism figures importantly in the organization of exemplar memory and that the number of records that are available for retrieval depends upon the motivational state of the organism. For example, organisms must learn quickly about potentially harmful stimuli. This suggests that the capacity of a “danger memory” must be relatively small to allow for rapid learning.
![]()
Footnote 5. Both Ashby (see Ashby & Waldron, 1999) and Nosofsky (1986, 1991) have obtained data similar to ours in which human participants categorized stimuli that were probabilistically associated with two response categories. Ashby’s approach is similar to our statistical decision model, Nosofsky’s is similar to our exemplar model. Perhaps because of the complexities associated with the analysis of performance by human participants, these investigators do not appear to be aware that both models are compatible, at least to a first approximation.
![]()
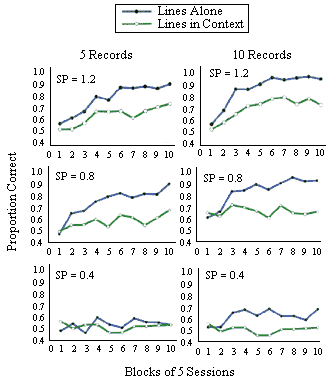
Figure 20. Simulations of Donis and Heinemann (1993). Simulations were done for 5 and 10 items in working memory and three separations (SP) between of the points defining the figures.