
Entire Set of Printable Figures For
Cognitive Strategies and Foraging in Pigeons - Blough
![]()
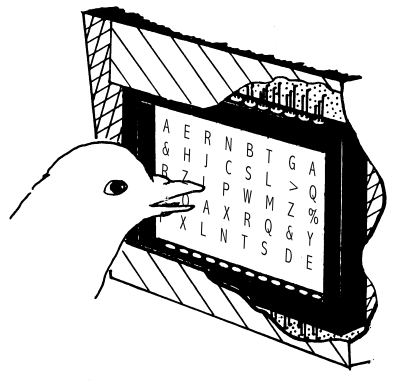
Figure 1. The display screen is surrounded by photocells, which sense the location of the pigeon's peck. The target letter (here the letter 'P') can appear in any location; when the bird pecks at a location the display goes blank, and a new display appears after a brief interval. Reaction time is the time between display onset and a peck response.
This approach permits precise
manipulations of perceptual and memory variables. For example, the present
display provides a difficult perceptual task, because there is a large and
heterogeneous set of distractors. The memory task would be easy if the target
was always the same letter. In many experiments, however, memory is burdened by
training the bird to peck any of several letters, only one of which appears on a
given trial.
The equipment permits the measurement of search speed (RT) as well as accuracy.
As noted above, RT provides a useful measure of information-processing style.
However, this measure and other aspects of our method simulate less well the
natural foraging situation
![]()
Video can't be printed
![]()
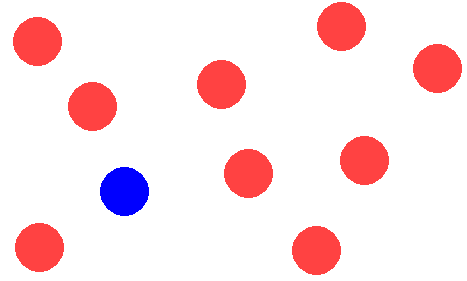
Figure 2. Example of a "Pop Out" visual display. Search RT is typically independent of the number of surrounding distracters.
![]()
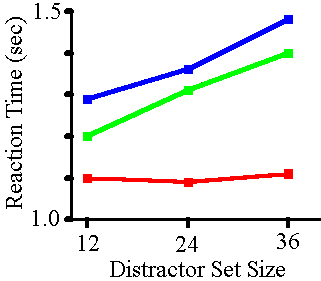
Figure 4. The relation between Reaction
Time and Distractor Set Size for
low (red),
medium (green)
and high (blue)
target-distractor similarity conditions in pigeons (Blough, 1992).
![]()
Animation can't be printed.
![]()
Figure 5. The blue
line describes the course of RT (in seconds) over six sessions for a
set size of four. The red line describes
this relation for a set size of one. Distractor Set Size =36 condition
From Vreven and Blough (1998).

![]()
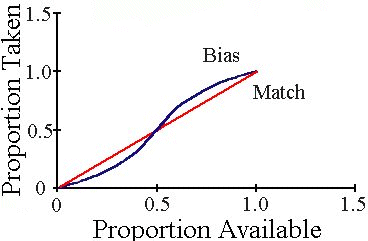
Figure 6. If birds take amounts of a given prey type in exact proportion to their density, their choices would be represented by the red line. If they overselect abundant prey; their choices would exceed the matching proportion at relatively high densities, but less abundant prey would be underselected as represented by the blue line.
![]()
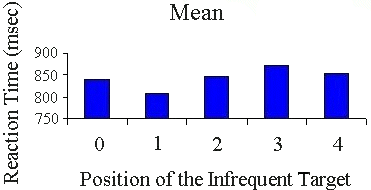
Figure 7. RTs associated with a frequent target as a function of the pattern of targets appearing on the 4 just-preceding trials. For the value 0 there was no infrequent target in that set. For the value 1, the single infrequent target appeared in the first (most distant) position; when it was 4 it appeared on the trial just preceding the measured RT. The differences among these RTs were not significant, and there was no evidence for carry-over effects of just seen stimuli.
![]()
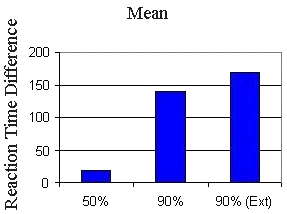
Figure 8. Shows RT differentials associated with the probability that a given target, drawn from a set of two, will appear. Ordinate values are RT (infrequent target)-RT (frequent target); larger differences are associated with speedier responses to the frequent target. When the target probabilities are equal (50%), the difference is negligible. The difference is sizeable when one of the targets appears on the majority of trials, and this effect is seen in sessions when no responses are reinforced (Ext).
![]()
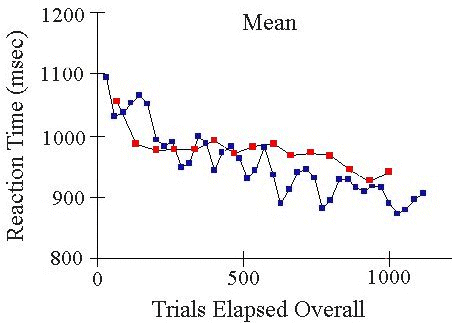
Figure 9. RTs for targets having a probability of .7 (blue symbols) and .5 (red symbols). Points represent summary RTs over blocks of 20 trials. Note that the red symbols are more spread out, because a relatively large number of trials must elapse before the appropriate trial block is completed.
![]()
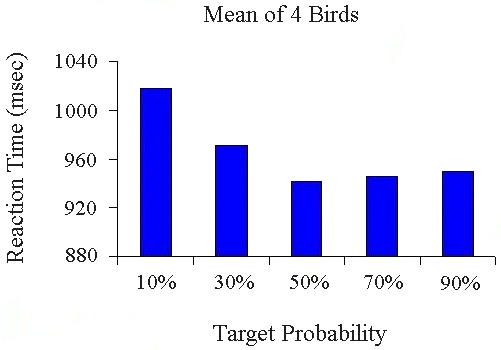
Figure 10. Shows RTs associated with targets having varying probabilities of appearing on a trial. Data come from a series of experiments that manipulated relative probabilities of two targets. To control for target-background similarity each bar represents combined data over a common set of target letters.
