Geometry, features, and orientation in vertebrate
animals: A pictorial review
Ken Cheng and Nora S. Newcombe
Macquarie University & Temple University
Fish
|
|
|
|
Figure D-1: Thanks to Giorgio Vallortigara and Valeria Sovrano for sending us pictures on their work, featured in this section. |
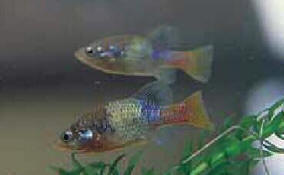
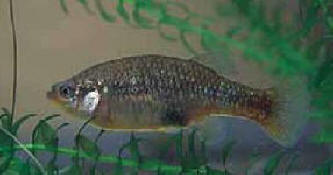
Sovrano, Bisazza, and Vallortigara (2002, 2003) tested fish Xenotoca eiseni.
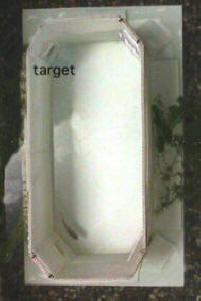 |
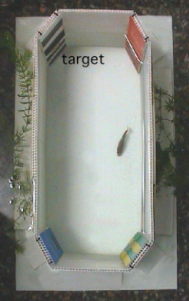
| Figure D-2: Apparatus used
in Sovrano, Bisazza, and
Vallortigara (2002, 2003) |
The task for the fish was aversively motivated. They were to swim out of the rectangular arena, through one of the doors in the corners, to join their peers. One of the doors was always the correct one (the others would not open). The arena was rotated from trial to trial. Again, this was a reference memory task. This picture shows a condition in which only geometric cues were available. The fish learned this task, concentrating their search at the correct corner and its diagonal opposite.
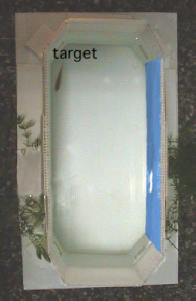 |
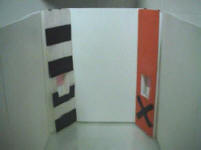
| Figure D-3: Apparatus showing
featural cue |
Fish were also trained and tested in arenas with featural cues, such as a blue wall …
 |
| Figure D-4: Apparatus showing
featural cues in each corner |
… or panels in the corners.
 |
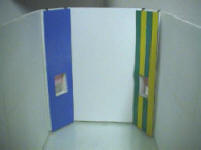 |
| Figure D-5: View of featural cues in corner panels |
These two pictures show closer views of the panels in the corners.
Fish learned to use the featural cues, a colored wall or panels. They searched mostly at the correct corners, and did not make systematic rotational errors. In this way, they resemble the birds, except that their performance level was typically worse.
 |
| Figure D-6: Schematic of
geometry-only test following
geometry & feature training |
When trained with features (left) but tested with features removed (right), the fish still used geometric cues. In the example in this picture, they would search mostly at the top left or bottom right. Thus, as with birds and rats, learning to use features did not overshadow the learning of geometry.
 |
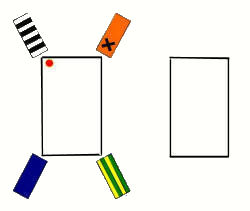
| Figure D-7: Schematic of
conflict test |
The fish were also presented with conflict tests. On these tests (right), the panel at the target was moved to a geometrically different corner, resulting in a conflict between geometric and beacon cues. The fish split their choices between geometry and beacon. In this example, they would search at the top left (geometrically correct), top right (correct beacon), or bottom right (geometrically correct). The results were that the bottom left (geometrically and featurally wrong) was chosen the least.
 |
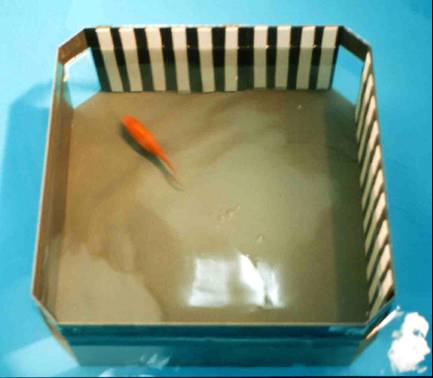
| Figure D-8: Thanks to Juan Pedro Vargas for the photos of the goldfish and apparatuses. |
Vargas, López, Salas, and Thinus-Blanc (2004) tested goldfish (Carassius auratus) in an escape task akin to the task that Sovrano et al. (2002, 2003) used. The goldfish were trained with geometric and featural cues; featural cues were stripes on two adjacent walls.
 |
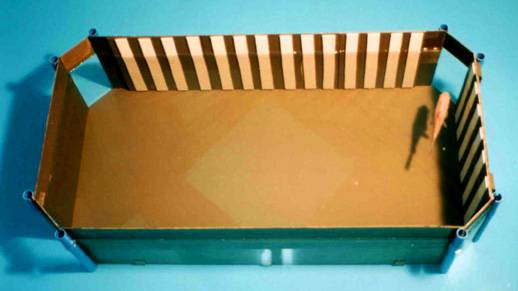
| Figure D-9: |
Goldfish proved adept at learning to use both geometric and featural cues. On this test, the featural cues had been removed. The fish used the geometric cues, searching mostly at the correct corner or its diagonal opposite.
 |
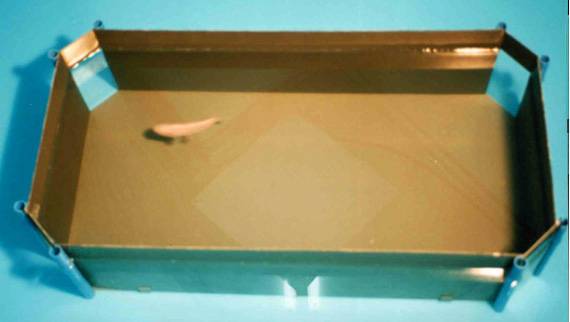
| Figure D-10: |
On this test only featural cues were provided; the arena had been transformed into a square. Fish succeeded in the task, choosing mostly the correct corner.
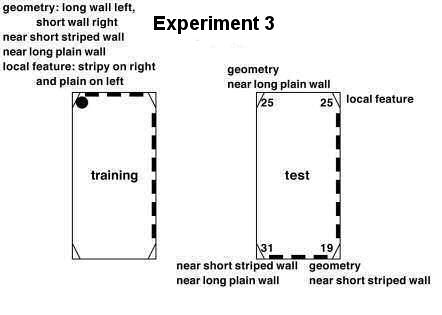 |
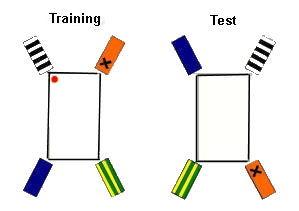
| Figure D-11: Results (percentages) and alternative explanation of Experiment 3 of Vargas et al. (2004). |
Dissociation tests were also conducted. On these tests, the stripes were shifted in the manner shown (training situation on left, test situation on right). On this test, the fish were at chance choosing the four corners. We explain the labels below.
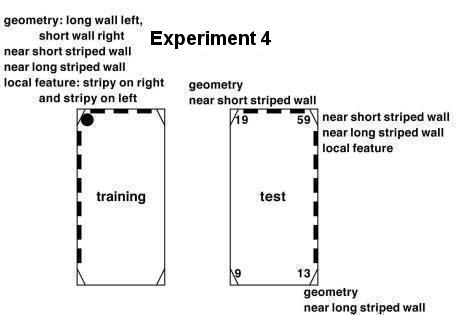 |
| Figure D-12: Results (percentages) and alternative explanation of Experiment 4 of Vargas et al. (2004). |
The results of a dissociation test depended on the target location. With a target location at an intersection of striped walls, the fish went with the featural cues most (some 60%), chose the geometrically correct corners next most, and chose the fourth corner least.
Explaining dissociation tests
Vargas et al. interpreted the results from dissociation tests as showing the fish to use different strategies in the two test situations. In the first situation (their Experiment 3) with the chance results, the fish were said to use a map-like strategy. In the second test situation, in which the fish preferred featural cues, they were said to use a guidance strategy.
It seems problematic to base an interpretation of map-like strategy on chance results. And the guidance strategy also does not explain why geometrically correct corners were chosen more often than the fourth corner in the second test situation.
|
|
| Figure D-13: Results (percentages) and alternative explanation of Experiment 3 of Vargas et al. (2004). |
As an alternative explanation (Cheng, 2005), we tallied up the likely properties that the goldfish might attempt to match on a test (left), and assumed that the fish would try to match as many as possible. Geometry (long wall to the left, short wall to the right) was one property. A local feature to match consisted of having stripy wall on the right and plain wall on the left. (Panels were left out of consideration because they are the same in every corner.) A property of being near a wall of particular length and decoration pattern (stripy or plain), irrespective of which end of the wall was nearest to the corner, was also considered a property to match. The right panel shows that these properties are distributed across the four corners on the test in Experiment 3. One reasonable prediction is that the fish would search about equally at all four corners, a prediction confirmed by the data.
|
|
| Figure D-14: Results (percentages) and alternative explanation of Experiment 4 of Vargas et al. (2004). |
In Experiment 4, however, when the same set of properties tallied on the left panel are distributed among the different corners on the test, we see that the corner with the correct local feature has the most properties, the two geometrically correct corners have the next most properties, while the corner at the bottom left has nothing to recommend it for matching. The results reflect this ordering.
In this fashion, a single representational scheme explains both experiments, with no need to invoke different strategies in different situations. Whether an explanation along these lines proves better than Vargas et al.’s two-strategies interpretation remains to be tested.
|