![]()
|
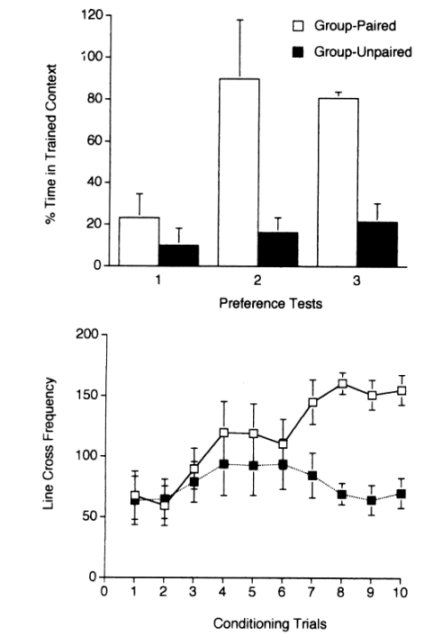
Figure 10. Mean percentage of time subjects spent in the trained context for paired and unpaired group subjects during each preference test (top panel) and mean line cross frequency during the first 5-min of each conditioning trial (bottom panel). |
Figure 10.