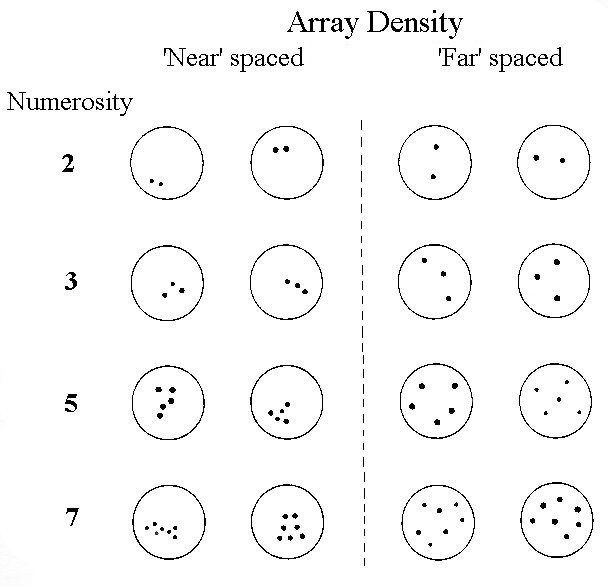
Figure 7. Sample of arrays at high (‘near’) and low (‘far’) densities. When the numerosity was 1 (not shown), the single dot varied in size and location. In the experiment, the arrays were white dots on a dark background.