![]()
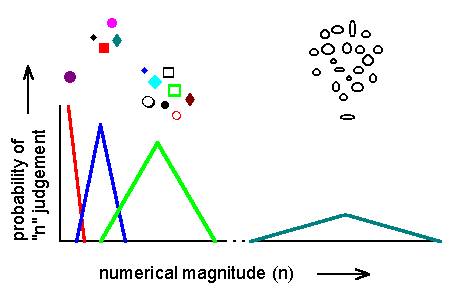
Figure 14. An animal judges the numerical magnitude of various stimulus groups and assigns a code or tag (represented by the color of each curve) for each magnitude. On average, it accurately assigns a specific tag for each amount, as shown by the peak probability for each "n" judgement. But the probability of assigning a tag varies: as numerical magnitude increases, so does the variance of the judgements. Where curves overlap, the animal may tag the number of items incorrectly. Note: the figure is not drawn to scale.
