![]()
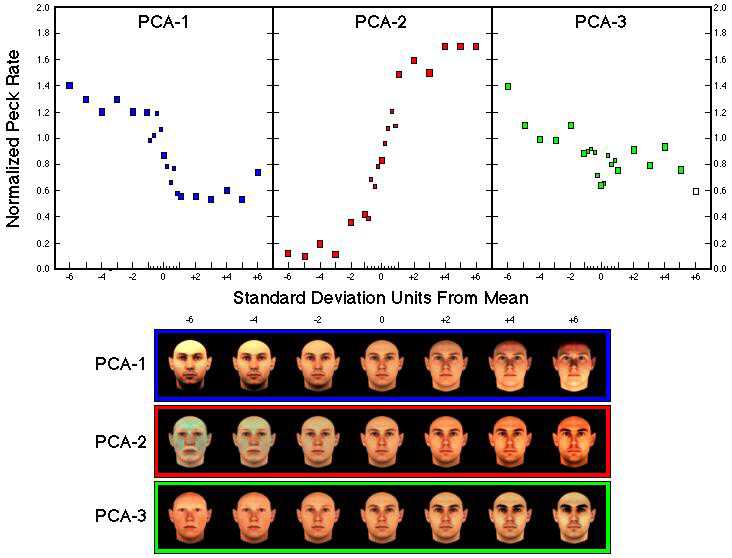
| Figure 32. Normalized response rates as a function of distance from the average face (measured in standard deviations) along the first three principal components in both directions (Humber et al., subm.). Data points representing the peck rates to the faces between -1 and +1 standard deviation from the mean are given as small squares. Seven examples of the synthetic faces for the first three principal components are shown below. |