![]()
|
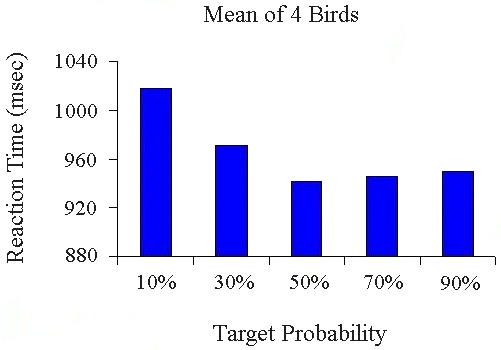
Figure 10. Shows RTs associated with targets having varying probabilities of appearing on a trial. Data come from a series of experiments that manipulated relative probabilities of two targets. To control for target-background similarity each bar represents combined data over a common set of target letters. |
