![]()
|
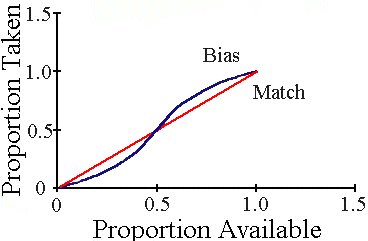
Figure 6. If birds take amounts of a given prey type in exact proportion to their density, their choices would be represented by the red line. If they overselect abundant prey; their choices would exceed the matching proportion at relatively high densities, but less abundant prey would be underselected as represented by the blue line. |
