Entire Set of Printable Figures For
Visual Control of Sexual Behavior - Akins & Burns
![]()
![]()
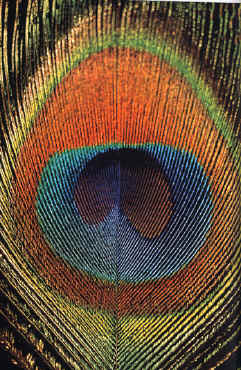
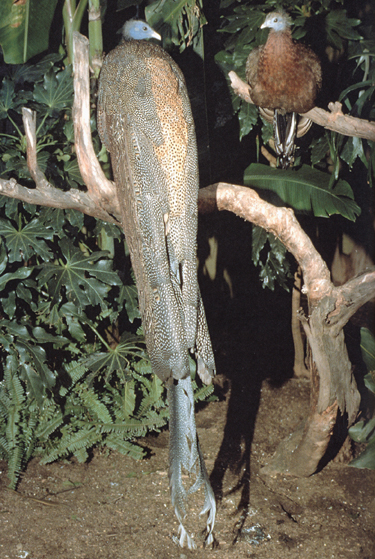
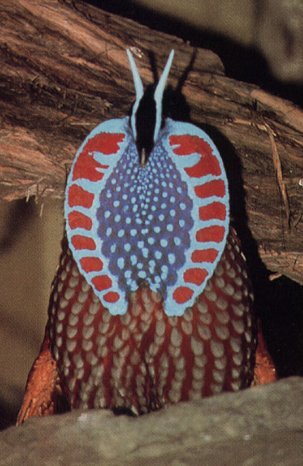
Peafowl Bulwer Pheasant
![]()
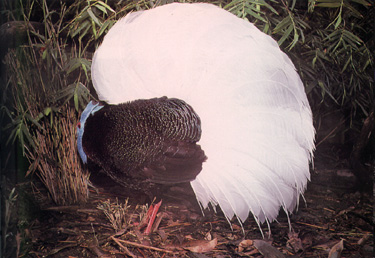
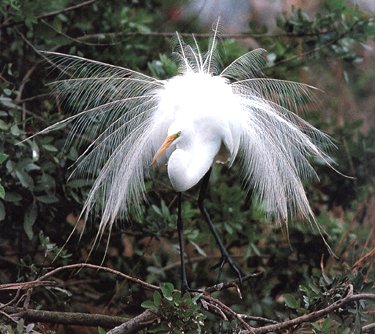
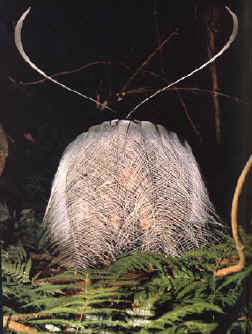
Great Argus
![]()
Great Egret
![]()
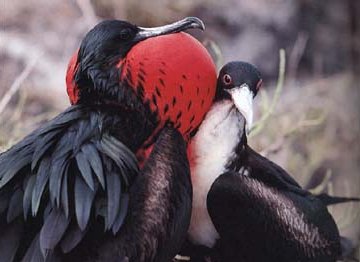
Lyre Bird Frigate Bird
![]()
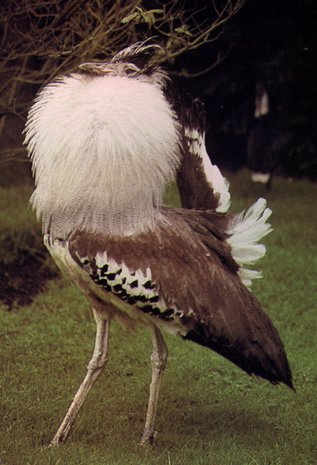
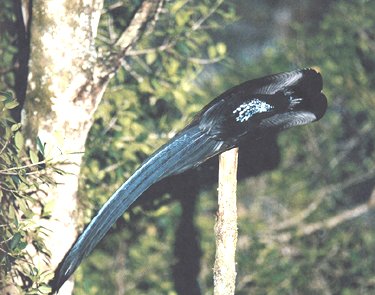
Kori Bustard Black Sicklebill
![]()
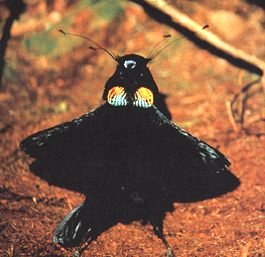
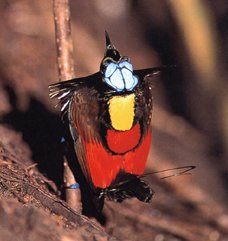
Parotia Bird-of-Paradise Wilson Bird-of-Paradise
![]()
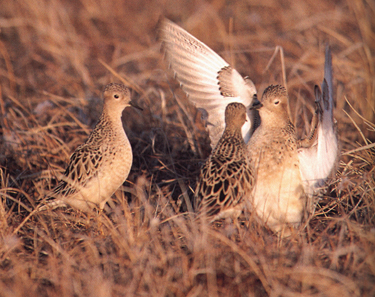
Wire Bird-of-Paradise Buff Breasted Sandpiper
>
![]()
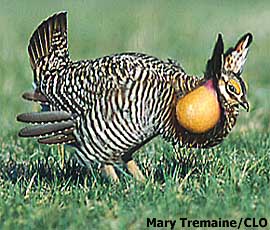
Prarie Chicken Count Raggis Bird-of-Paradise
![]()
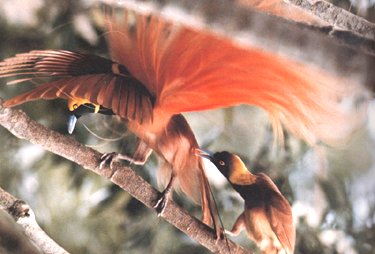
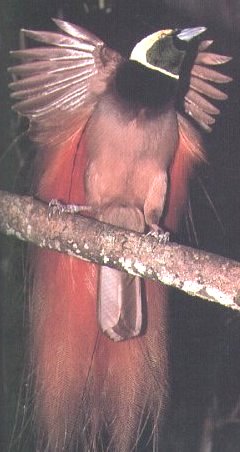
Raggiana Bird-of-Paradise Temmink Tragopan
![]()
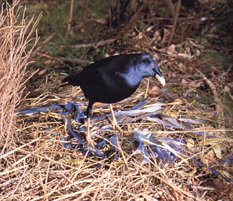
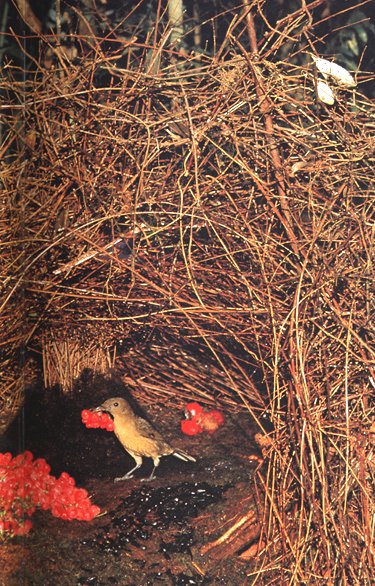
Satin Bowerbird Vogelkop Gardner Bowerbird
![]()
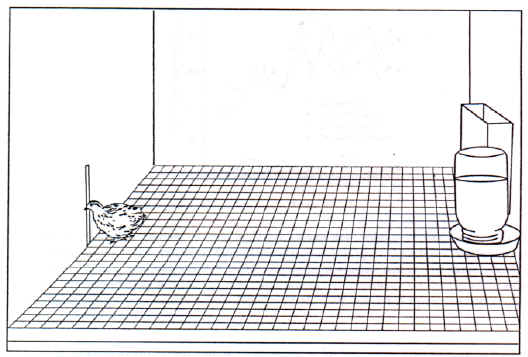
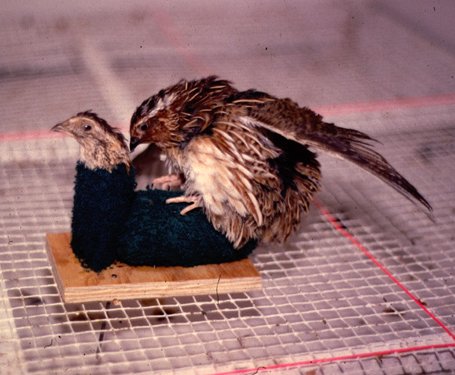
Figure 2. A male quail looking through a window at a female on the other side, after visual access to the female had been paired with copulatory opportunity.
![]()
Figure 3.
![]()
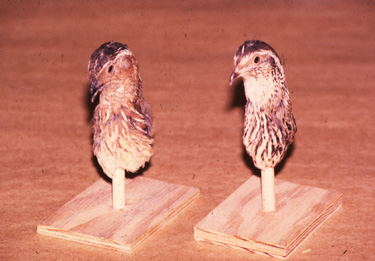
Taxonomically Preserved Heads
![]()
Video Display Can't be Printed
![]()
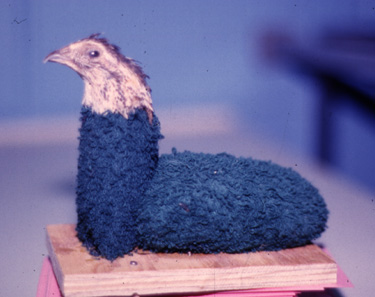
Taxonomic Terrycloth Body
![]()
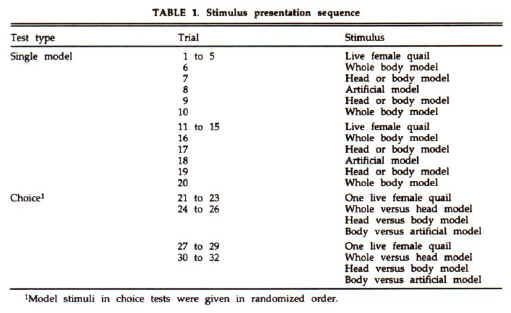
Table1.
![]()
Copulation with Taxonomically Preserved Head
![]()
Figure 4. Mean cloacal contact movements directed toward taxidermic models in choice tests. Error bars indicate SEM. Significance levels of paired comparisons: * = P < .05.
![]()
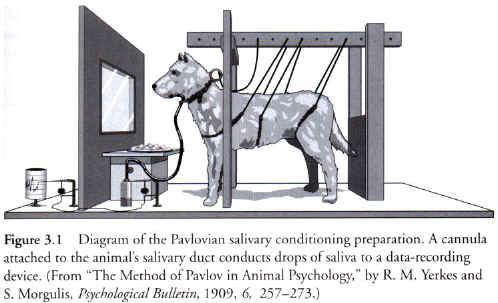
From Sidebar - Pavlovian Procedure
![]()
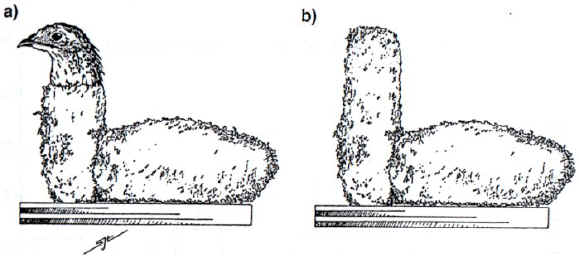
Figure 5. The CS objects used in Experiment1 and Experiment 2. Both objects were made of blue terrycloth and filled with soft polyester fiber and consisted of a vertical section positioned in front of a horizontal mounting pad. The CS object used in Experiment 1 had a taxedermically prepared female head and partial neck mounted on top of the vertical section (a). Blue terrycloth replaced the female species typical cues on the CS object used in Experiment 2 (b).
![]()
Figure 6. Mean time spent near the conditioned stimulus during the CS period (top panel) and during the pre-CS period (bottom panel) during 25 successive conditioning trials for experimental and control subjects in Experiment 1.
![]()
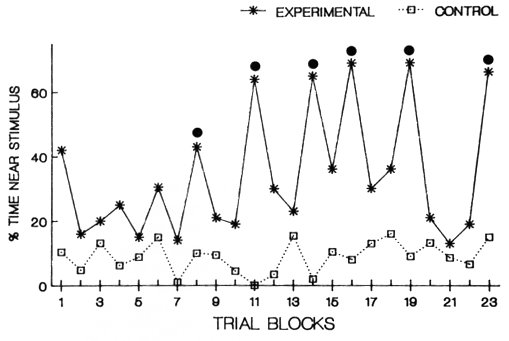
Figure 7. Mean percentage of time experimental and control groups were observed near the stimulus compartment during Experiment 4. Data for trials without the toy dog are presented in blocks of two trials. Data for trials with the toy dog are presented in blocks of one trial; these single-trial blocks are identified by filled circles above the points.
![]()
Figure 8.
![]()
Figure 9.
![]()
Figure 10.
![]()
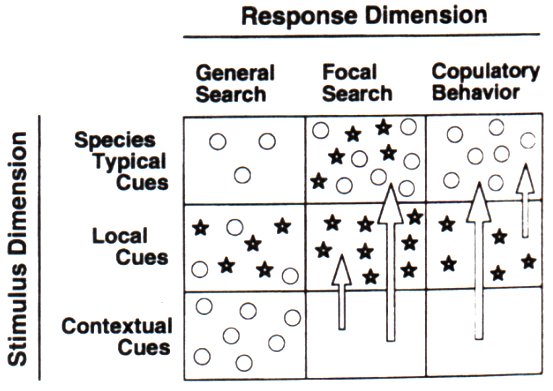
Figure 11. The response profile of the sexual behavior system after conditioning. The density of the open circles (unconditioned effects) and the stars (conditioned effects) represents the degree of control of each type of stimulus over each type of response. Arrows represent conditioned modulatory influences.