
Entire Set of Printable Figures For
Birds' Judgments of Number and Quantity - Emmerton
![]()
Figure 1.

![]()
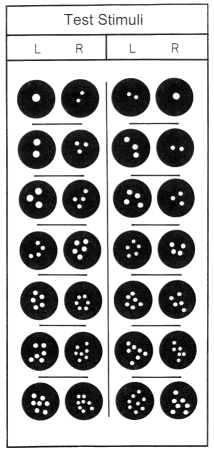
Figure 2. Examples of novel transfer stimuli in an experiment reported in Emmerton & Delius (1993). Paired numerosities varied from 1 vs. 2 to 7 vs. 8 on intermixed test trials. L and R indicate the left or right pecking keys on which the arrays appeared.
![]()
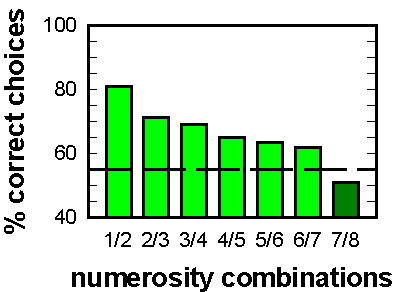
Figure 3. Results of testing 8 pigeons with novel arrays. Dashed line: scores were significantly above chance (p = .05). (Adapted from Emmerton & Delius, 1993).
![]()
Footnote 1.
Davis & Pérusse’s Classification of Numerical Competence
Davis and Pérusse (1988) distinguish several types of numerical competence and suggest that different cognitive or perceptual processes underlie each type. They divide numerical competence into the categories of relative numerousness judgments, subitizing, estimation, and counting.
They assume that relative numerousness judgments involve the simplest decision processes since no knowledge of absolute number is required. Instead an animal judges numerical inequalities that are ordered in magnitude (e.g. "more" vs. "less" decisions). In this chapter, the term "numerosity discrimination" is used instead of relative numerousness judgments.
Subitizing is a form of pattern recognition that is used to rapidly assess small quantities of items. A label is then assigned to the perceived array. For instance, a glimpse of several dots arranged at the angles of an imaginary triangle leads to a judgment about the specific quantity. For us, that quantity would be labeled "3" because we know that triangles have three corners. For an animal, that quantity might simply be labeled "correct amount – peck it!" without the animal necessarily knowing how this quantity relates to other numerical values. Other researchers doubt there is a separate subitizing process however (see section VI on Models and Mechanisms for Numerical Processing).
Estimation refers to the ability to assign a numerical label to an array of large numbers of items without having to count or enumerate each one. When we judge at a glance that there are about 50 ducks on a lake we are "estimating". Animals’ judgments of large number arrays have not been systematically studied yet.
Counting is the ability to discriminate the absolute number in a set by a process of enumeration. This involves tagging each item in a set, and applying a series of ordered labels as these items are ‘counted off’. To count the number of peanuts in a packet of mixed nuts, for instance, we might put each peanut to one side, at the same time labelling them "1", "2", "3", etc. The numerical label we apply to the last peanut we find is the absolute or cardinal number of peanuts in the packet. The criteria for counting behavior have been defined by Gelman and Gallistel (1978) (see section IV on Cardinal Numbers and Counting). Davis and Pérusse regard counting as a more complex process than the ones involved in relative numerousness judgments or subitizing (and presumably estimation too).
They also discuss the concept or sense of number as an attribute of counting. This term implies an ability to transfer numerical discriminations across sensory modalities (e.g. 5 sound pulses are equivalent to 5 light flashes) or across modes of presentation (e.g. 4 red squares shown simultaneously on a computer screen are equivalent to 4 red squares presented one after the other).
![]()
Figure 4.

![]()
Animation can't be printed.
![]()
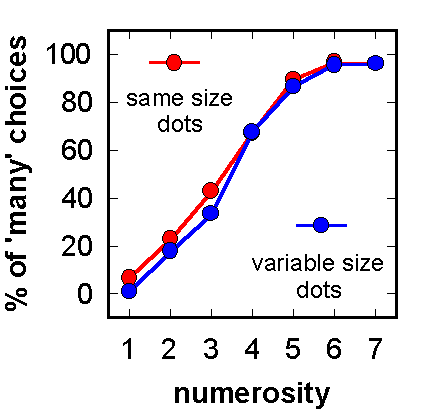
Figure 5. Test choices with novel arrays after pigeons learned to discriminate "many" from "few" dots. The summed areas of the dots, and thus the array brightnesses, were equated across numerosities. Dot sizes were the same or variable within an array. (Adapted from Emmerton et al., 1997.)
![]()
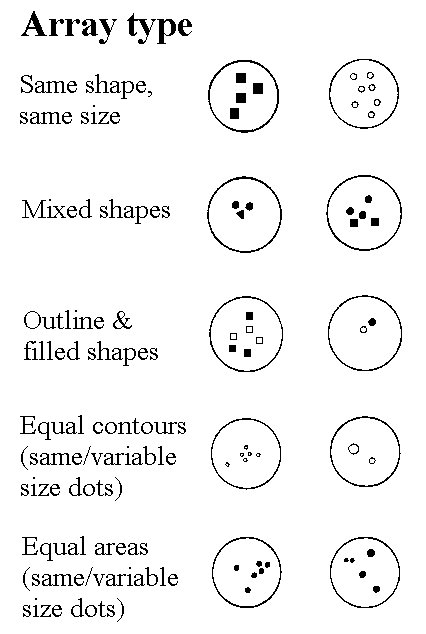
Figure 6. Sample of arrays used in various tests of serial ordering. Numerosities ranged from 1 to 7 items. In the experiment, the arrays were shown in reversed contrast. The results in Fig. 5 are based on arrays equated for area.
![]()
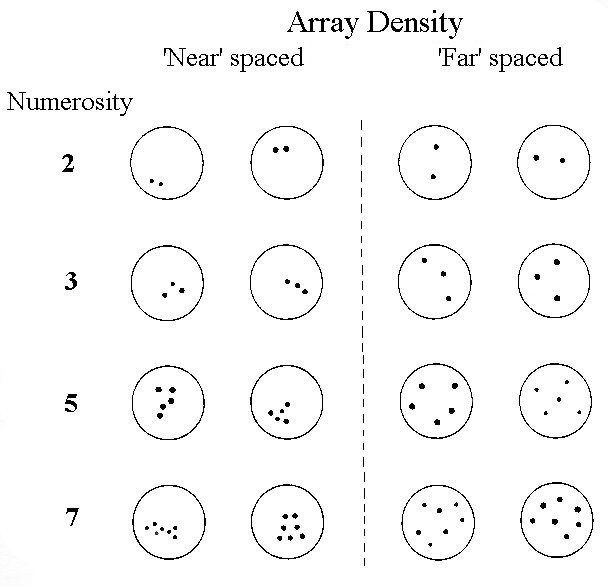
Figure 7. Sample of arrays at high (‘near’) and low (‘far’) densities. When the numerosity was 1 (not shown), the single dot varied in size and location. In the experiment, the arrays were white dots on a dark background.
![]()
Footnote 2.
Counting Criteria
Gelman and Gallistel (1978) list three criteria that formally define the process of counting. They are:
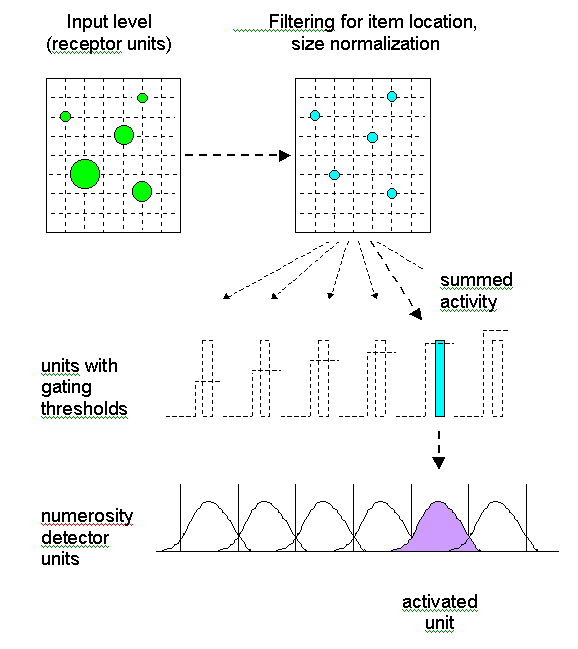
Each item in a set (or event in a sequence) is given a unique tag, code or label so that there is a one-to-one correspondence between items and tags. No item or tag may be omitted, nor conversely used more than once. In pacemaker-accumulator models of counting (see section VI), the code or tag is equivalent to the current value of pulses in the accumulator or in working memory. In the neuronal filtering model, the tag corresponds to the particular numerosity detector that has been activated.
The tags or labels must always be applied in the same order (e.g. 1, 2, 3, 4 and not 3, 2, 1, 4). This principle underlies the idea of ordinality – that the label "3" stands for a numerosity greater than the quantity called "2" and less than the amount called "4". In counting models (see section VI) this ordering of tags is achieved by the progressive accumulation of pulses, or the increasing thresholds that must be crossed for different numerosity detectors to be activated.
The label that is applied to the final item represents the absolute quantity of the set.
Two other principles generally apply but are not fundamental to the process of counting. These are:
Any types of items may be counted (e.g. birds in a flock or windows in a building).
The order in which the items themselves are tagged is irrelevant. (If we want to count the number of flowers in a bunch, it does not matter which one we label "1", which we label "2", etc.)
![]()
Video can't be printed.
![]()
Footnote 3.
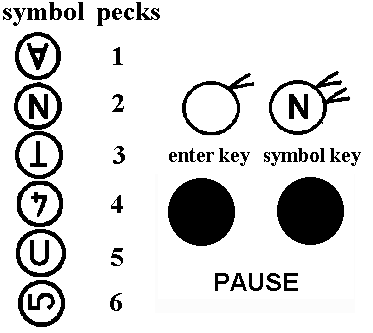
Left Side - Different symbols denote specific numbers of pecking
responses.
Right Side - When a symbol appears on the symbol key, the bird has to
peck it the required number of times (e.g. 2 pecks to N), then peck once to the
enter key. A food reward is given for a correct response sequence, and
timeout for an incorrect one.
![]()
Animation can't be printed.
![]()
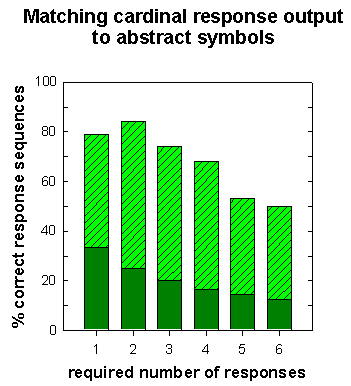
Figure 8. Mean performance (bar height) for pigeons trained to emit a specific number of responses to 6 different visual symbols. Solid portion of bar: chance level of correct responding. (Data from Xia, Siemann, & Delius, 2000.)
![]()
Animation can't be printed.
![]()
Figure 9. Pigeons’ discrimination of the proportion of red/green color in pairs of horizontal bars. Choice of the bar containing the greater proportion of positive color was rewarded. The positive color was red or else green for different birds. pcS+ = proportion of positive color in correct bar. pcS- = proportion of positive color in incorrect bar.

![]()
Animation can't be printed.
![]()
Figure 10. Pigeons’ discrimination of color proportion with arrays of red and green rectangles.

![]()
Animation can't be printed.
![]()
Figure 11. Test of discrimination based on disparity ratio in red/green horizontal bars. Color proportions in paired stimuli were complementary in rewarded training trials (S+/S-) but not in non-reinforced test trials (S+/0.5 and 0.5/S-). Discrimination performance was related to relative rather than absolute differences in proportion.

![]()
Figure 12.

![]()
Figure 13.
![]()
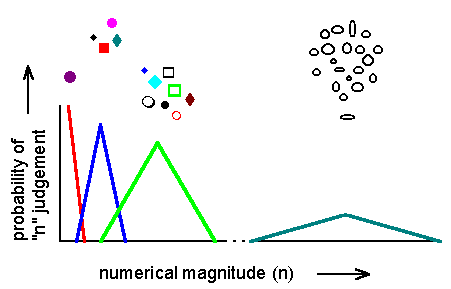
Figure 14. An animal judges the numerical magnitude of various stimulus groups and assigns a code or tag (represented by the color of each curve) for each magnitude. On average, it accurately assigns a specific tag for each amount, as shown by the peak probability for each "n" judgement. But the probability of assigning a tag varies: as numerical magnitude increases, so does the variance of the judgements. Where curves overlap, the animal may tag the number of items incorrectly. Note: the figure is not drawn to scale.
![]()
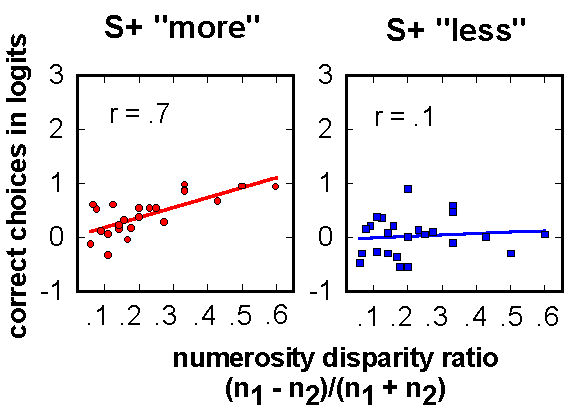
Figure 15. Transformed mean data from pigeons’ early training with arrays of "more" or "less" dots. Performance level was significantly related to relative numerosity differences for the group trained to choose "more", but not for birds that had to choose "less". n1, n2 are the number of dots in paired stimulus arrays.
![]()
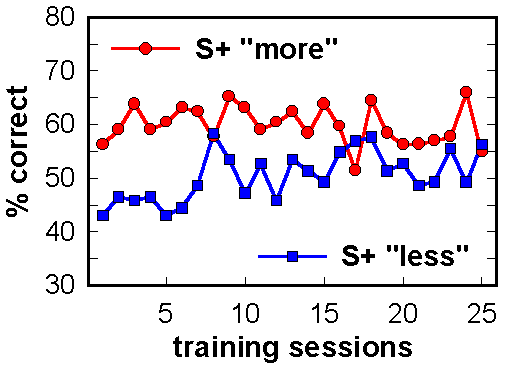
Figure 16. Initial acquisition of "more" vs. "less". One group of pigeons was trained to choose the arrays with the greater number of dots. The other group, shown the same stimuli, was trained to choose the arrays with fewer dots. Mean scores are shown.
![]()
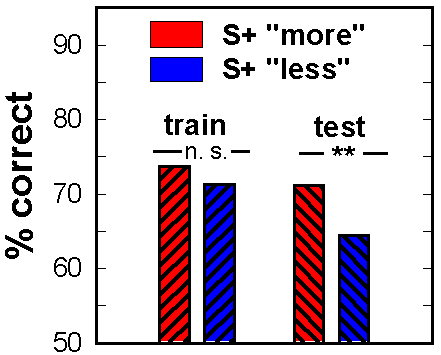
Figure 17. Pigeons trained to choose "more" or "less" numerous arrays performed differently (p < .01) on non-reinforced test trials with novel stimuli, but not on reinforced training trials with familiar stimuli.
