
Entire Set of Printable Figures For
Anticipation and Short-Term Retention in Pigeons - Grant & Kelly
![]()
Animations can't be printed
![]()
Figure 1. Sample-to-Choice Mapping used by Roitblat (1980).

![]()
Figure 2. Matching accuracy during variable-delay testing. The choice stimuli were lines in the left panel and colors in the right panel. After Urcuioli and Zentall(1986).

![]()
Figure 3. Design used by Urcuioli et al. (1989).

![]()
Figure 4. A different outcome procedure
using food and water as outcomes
(Broddigan & Peterson, 1976).

![]()
Figure 5. A differential outcome procedure using food and no food as outcomes (Kelly &Grant, 1998b).

![]()
Figure 6. Acquisition of 0-s delayed matching. The outcome following correct choice was either food or no food. Kelly and Grant(1998b).

![]()
Figure 7. Matching accuracy during variable-delay testing. the outcome following correct choice was either food or no food. Grant and Kelly (1998b).

![]()
Figure 8. A differential outcome procedure using blue and yellow keylight as outcomes (Kelly and Grant, 1998b).

![]()
Figure 9. Acquisition of 0-s delayed matching. The outcome following correct choice was either yellow or blue keylight. (Kelly and Grant 1998b).

![]()
Figure 10. Matching accuracy during variable-delay testing. The outcome following correct choice was either yellow or blue keylight. Kelly and Grant (1998b).
![]()
Figure 11. Procedure used by Honig and Wasserman (1981).
![]()
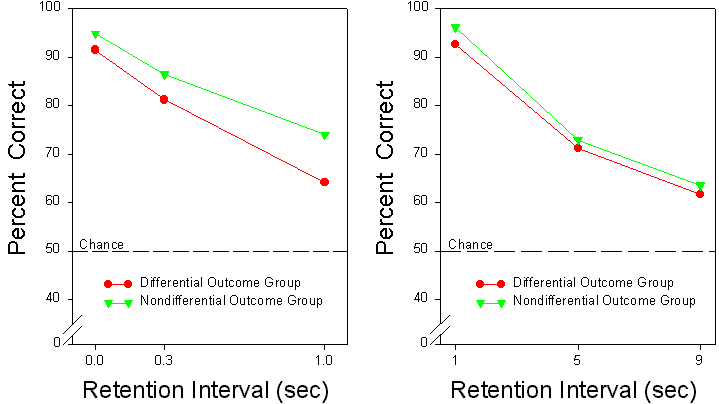
Figure 12. Matching accuracy during variable-delay testing. Honig and Wasserman (1981).
![]()
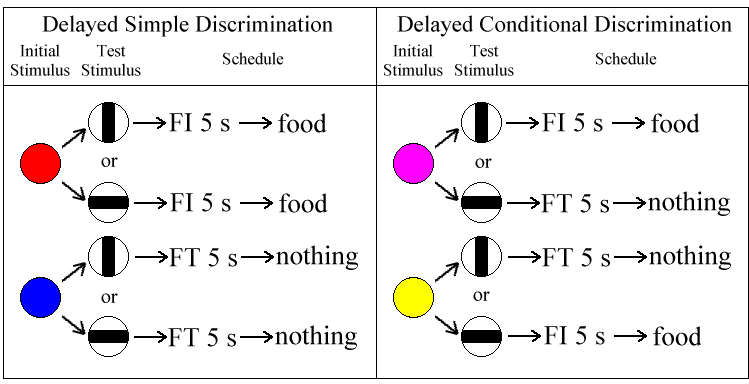
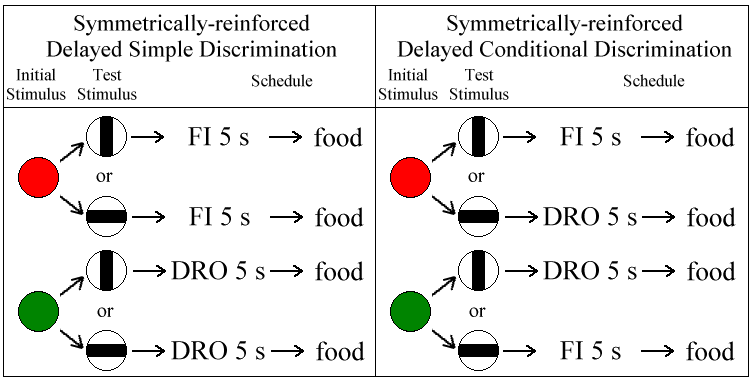
Figure 13. Procedure used by Urcuioli and Zentall (1990).
![]()
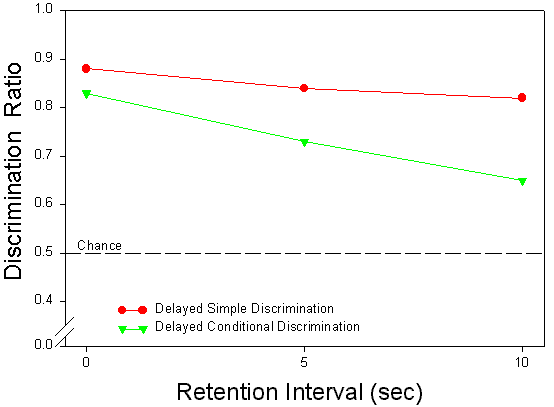
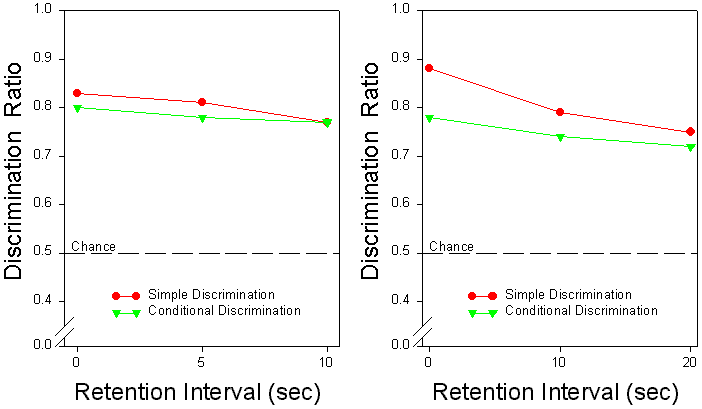
Figure 14. Matching accuracy during variable-delay testing. The delays were 0, 5, and 10 s in the first test (left panel) and were 0, 10, and 20 s in the second test (right panel). After Urcuioli and Zentall (1990).
![]()
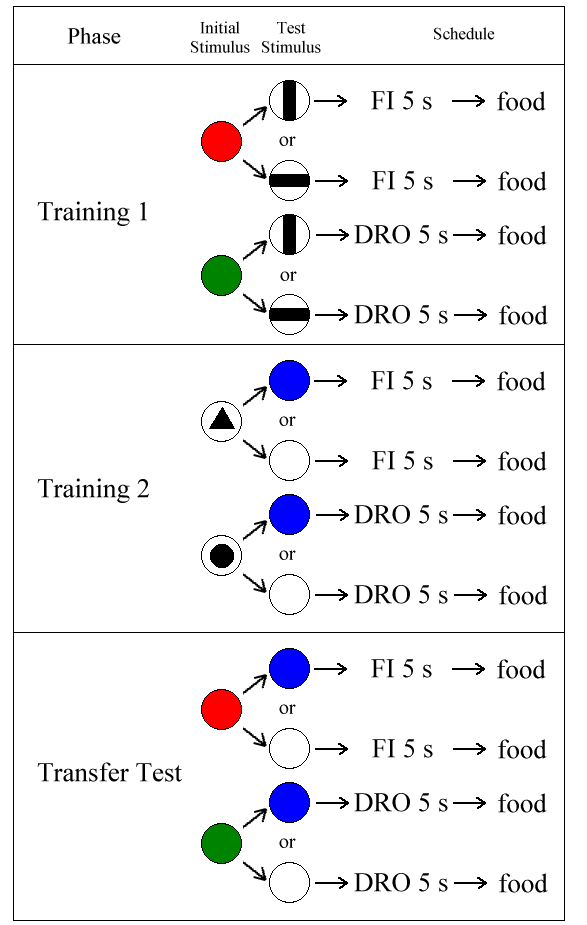
Figure 15. Procedure in one group used by Urcuioli and Zentall (1992, Exp. 1).
![]()
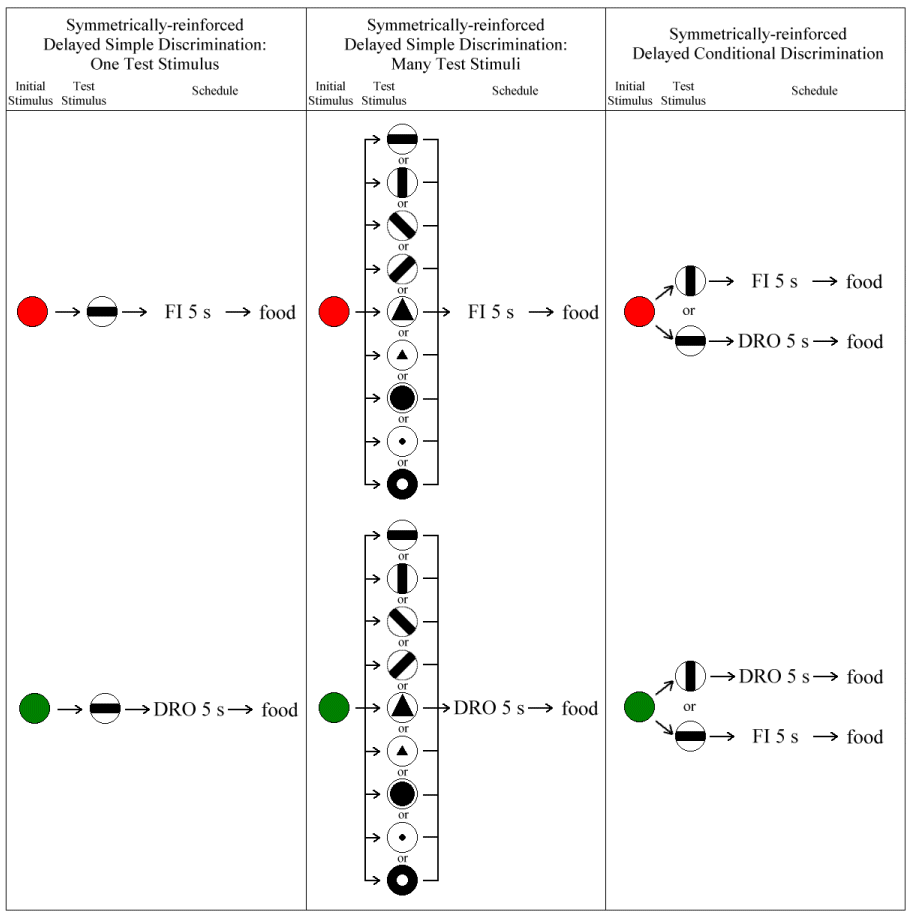
Figure 16. Procedure used by Grant et al (1997).
![]()
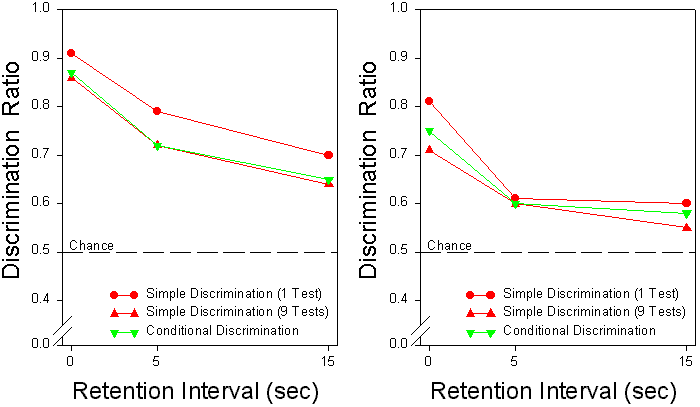
Figure 17. Matching accuracy during variable-delay testing. The initial stimuli were colors in the left panel (Grant, Kelly, & Steinbring, 1997) and lines in the right panel (Grant & Kelly, 1998).
