Entire Set of Printable Figures For
Visual Categorization in Pigeons - Huber
![]()
Figure 2. An example of the Strasser strain of pigeon.
![]()
Hyperlinks can't print.
![]()
Footnote 1. The Classical View of Categorization
Traditionally, categories were assumed to be isomorphic with respect to the definite structures, properties, and interrelationships of the "real" world. An old and influential idea is that the properties contained in these categories are singly necessary and jointly sufficient to define membership. Although other properties may be allocated randomly, natural categories will always include a set of "essential" or "criterial" features.
Categorization refers to the extraction of these "critical" features by the application of a predefined interactive algorithm of the mind. According to this classical or "Lockean" position, categorization is conceptual; it is an inferential process that works on the arbitrary perceptual categories of the world. Needless to say, such categorizing powers were assigned to the human mind alone.
In the midst of our century, the dominance of the classical view has been seriously undermined by the collective work of philosophers (e.g. Wittgenstein, 1953; Ryle, 1949), linguists, and psychologists (Rosch, 1975; Rosch, 1978; Rosch & Mervis, 1975). Wittgenstein, for example, reflected on the polymorphism of common-sense language concepts, while Rosch and colleagues were able to empirically support the concept of family resemblance by testing the classification performance of humans with basic level concepts. The probabilistic or fuzzy view of categorization that emerged in this study was thought to be a means of grouping objects that are characterized by large clusters of attributes. These attributes do not occur in an all-or-none fashion, but recur approximately in subsequently perceived instances and are oftly perceptually salient.
Comparative psychologists and ethologists studying the conceptual behavior of animals do not believe in any form of the classical view. Categorization is assumed to be perceptual, and all animal experimenters have denied that the boundaries of natural categories are clear-cut, that membership can be defined by necessary and sufficient conditions, and that logical rules guide the grouping of objects or events. Even for humans, the available evidence suggests that group membership is graded and assessment is based upon characteristic or probable properties alone.
![]()
Figure 3. The symmetrical and asymmetrical compact patterns used in Huber et al., 1999.
![]()
Figure 4. The symmetrical and asymmetrical scattered patterns used in Huber et al., 1999.
![]()
Figure 5. Schematic illustration of the go/no-go procedure. Important events are indicated by red arrows. The time during which a stimulus is present is marked yellow; the time during which food is available is marked green. Pecks are indicated by vertical lines above the time line (in this example, four pecks would have been recorded).
![]()
Footnote 2. Herrnstein's Rank-Order Statistic, Rho
In order to determine discrimination performance is such a daily session we rank the peck rates counted in every trial. We then calculate the probability that a randomly selected positive exemplar will be ranked higher than a randomly selected negative exemplar by using the non-parametric Mann-Whitney U test. The resulting U value is then linearly transformed into Herrnstein's (Herrnstein et al, 1976; Herrnstein, 1979) rho measure of discrimination. It makes no assumptions about the underlying distributions of response rates. When rho is 0.5, discrimination is absent; and when rho is 1.0, discrimination is perfect. With 20 positive and 20 negative stimuli, a rho of 0.68 indicates that discrimination is significant at the 0.05 level.
![]()
Figure 6. Learning curves for two groups during classification training with these stimuli. Lines fitted to the data plot the hyperbolic equation rho-0.5 + n (k-0.5)/(n+R), a convenient description of negatively accelerated learning curves (see Mazur & Hastie, 1978). n = session number, k = performance asymptote, R = learning rate. Huber et al. (submitted).
![]()
Figure 7. Test figures used in the first transfer test of Huber et al., 1999.
![]()
Figure 8. Examples on the modified training patterns used for the final test in Huber et al., 1999.
![]()
Figure 9. Mean deviation units calculated from comparing the pecking rates emitted to symmetrical and asymmetrical test patterns to either symmetrical (yellow) or asymmetrical (red) training stimuli.
![]()
Figure 12.
![]()
Figure 13. Learning curves for three pigeons during three phases of classification training with 10, 20 and 60 Brunswik faces. Huber & Lenz (1993).
![]()
Figure 14. Peck rate as a function of feature value for one pigeon in Phase 3 of classification training. Huber & Lenz (1993).
![]()
Figure 15. Peck rate as a function of feature sum for two pigeons in Phase 3 of classification training. The regression lines are based on the medians of the boxplots, Huber & Lenz (1993).
![]()
Figure 16. A version of Figure 15 with additional regression lines for the points representing the medium peck rates to the stimuli of each class, respectively.
![]()
Table 1. Percentage of explained variance for linear regression analyses of the predictions of several theoretical models with empirical data of five birds (P1 - P5).
| Model | Properties | P1 | P2 | P3 | P4 | P5 |
|---|---|---|---|---|---|---|
| variably weighted linear features | ||||||
| high similarity | ||||||
| individual attention weights | ||||||
| high
similarity & individual attention weights |
||||||
| dummy variable & frequency of stimulus presentation |
![]()
Footnote 3. Category discrimination with polymorphous features (Fersen & Lea, 1990).
The capacity to extract a polymorphous feature rule from several independent features is also likely to be influenced by the quality of the features themselves. By using photographs of natural scenes as stimuli, von Fersen and Lea (1990) were the first to show that pigeons can discriminate categories that have been synthetisized from natural categories in a polymorphous way. The features that defined category membership were themselves natural categories, with the usual polymorphous properties of such categories. Stimuli were photographs of two sites in Exeter, and the defining features were chosen to be of obvious importance to a free-flying pigeon. Features were 1) the site at which the photograph was taken (in front of Northcote House at the University of Exeter, and in front of the Crown and Sceptre, a pub in the center of the city), 2) the weather conditions (sunny or cloudy), 3) the distance of the building in the picture (near or far), 4) the orientation of the building (horizontal or oblique), 5) the camera height from which the pictures were taken (aerial or ground). One value of each feature was designated as positive, and pictures containing three or more positive feature values were members of the positive category. Although only half of the subjects came under the control of all five features spontaneously (the other half only after a special single-feature training), this experiment proved that pigeons successfully discriminate artificially defined categories that require to extract and combine as many as five 'natural' features. If natural categories are defined by a polymorphous combination of a large number of natural features that are themselves polymorphous in nature, the results can be taken with confidence as being in line with our conclusion that multiple feature learning is an adequate account of natural categorization.
![]()
Figure 18. Two-dimensional projection of the distribution of the stimulus classes in the multi-dimensional feature space from Huber & Lenz (1996).
![]()
Figure 19. The critical question concerns the form of the generalization gradient in the center of the distance dimension.
![]()
Figure 20. Mean response rates to stimuli presented in the transfer test as a function of distance from the prototype (radius). Huber & Lenz (1996).
![]()
Figure 21. Bars: Frequency of occurrence of feature values in the presentation of stimuli from Category POS for Bird CG2 during classification training. Lines: Peck rates as a function of feature values from this bird. Note: The values of the prototype for this bird were -2 for Eye and Chin and +2 for Brow and Nose. Huber & Lenz (1996).
![]()
Figure 22. Peck rates a function of feature value for the subjects that were trained with a single stimulus representing category NLG. The values of this single negative pattern are indicated by S-, the values of the positive prototype are indicated by P+. Huber & Lenz (1996).
![]()
Figure 23.
![]()
Figure 24.

![]()
Figure 25.

![]()
Figure 26.
![]()
Hyperlinks can't be printed.
![]()
Figure 27. Learning curves for three groups during classification training with 100 stimuli. Note: k is the performance asymptote and R is the learning rate (see Figure 5). Troje et al. (1999).
![]()
Figure 28. Transfer performance of three groups presented with 100 novel faces. For each group we computed the relative number of pecks emitted to positive and negative training as well as positive and negative test stimuli. Each bar represents the mean + s.e.m. (n = 8) Troje et al. (1999).
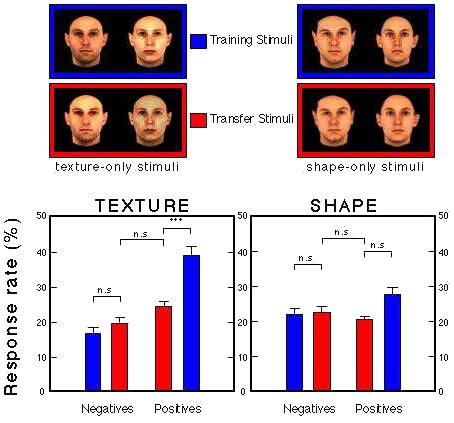
![]()
Figure 29. Transfer performance of two groups presented with 100 novel faces with ambiguous intensity (Group Texture) or size (Group Shape). Troje et al. (1999).
![]()
Figure 30. Differential pecking behavior in the presence of positive (red) and negative (black) training stimuli and their Gaussian derivatives. Huber et al. (in prep.).
![]()
Figure 31.
![]()
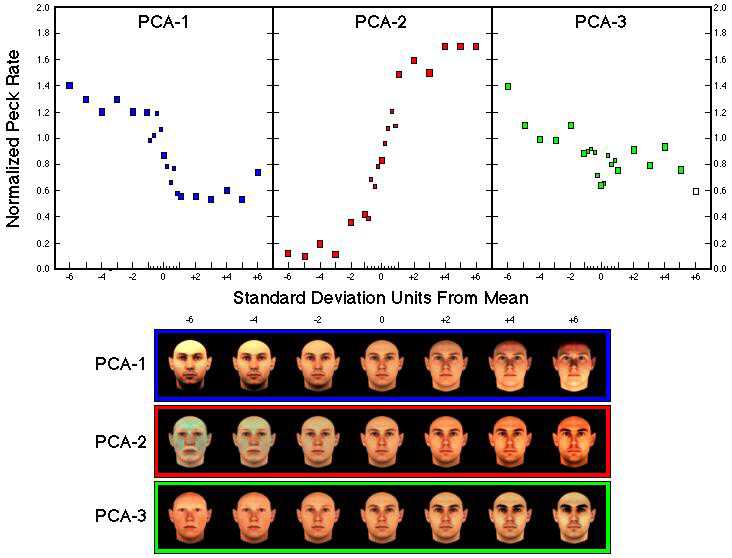
Figure 32. Normalized response rates as a function of distance from the average face (measured in standard deviations) along the first three principal components in both directions (Humber et al., subm.). Data points representing the peck rates to the faces between -1 and +1 standard deviation from the mean are given as small squares. Seven examples of the synthetic faces for the first three principal components are shown below.
![]()
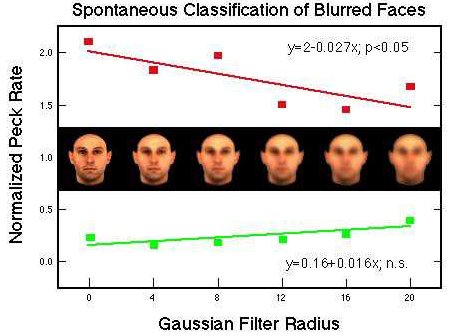
Figure 33. Differential pecking behavior in the presence of positive (red) and negative (green) training stimuli and their Gaussian derivatives. Huber et al. (in prep.).
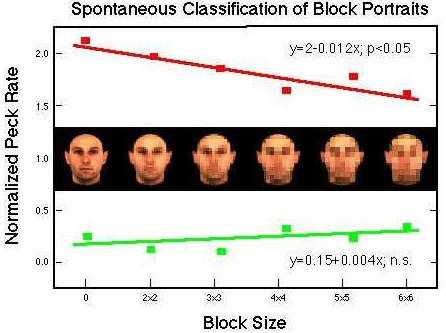
![]()
Figure 34. Differential pecking behavior in the presence of positive (red) and negative (green) training stimuli and their block portraits. Huber et al. (subm.).