

Entire Set of Printable Figures For
Object
Recognition - Kirkpatrick
![]()
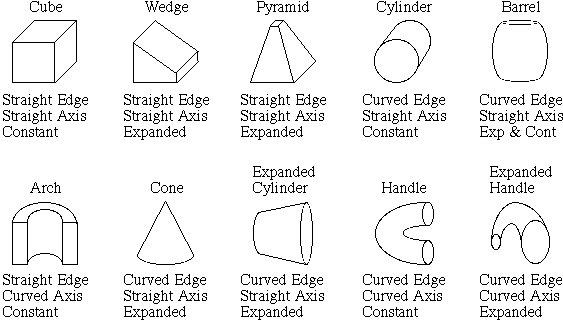
Above each geon is the geon's name. Below each geon is a list of nonaccidental properties : (1) straight or curved edges, (2) straight or curved axis, and (3) constant, expanded, or expanded and contracted sides. Certain properties of edges in a two-dimensional drawing are taken by the visual system as evidence that those edges in a three-dimensional world would contain the same properties. So, for example, if a two-dimensional drawing contains a curved line, the visual system infers that the same smoothly curved feature would exist in a three-dimensional setting. This inference made by the visual system demonstrates the principle of curvilinearity. Properties such as curvilinearity have been termined nonaccidental (Witkin & Tenenbaum, 1983) because they would only rarely be produced by accidental alignments of viewpoint and object features. An example of an acciental alignment is if a curved line fell on the retina in such a way that the curvature of the line exactly matched the curvature of the retina. Here, the line would be perceived as straight instead of curved. An accidental alightment of this sort is highly unlikely. Thus, the visual system operates under the assumption that the image falling on the retina is not an accident of viewpoint.
![]()
Four-Key Choice Testing Procedure
Training
Procedure. The initial phase of most of the experiments (except where
noted otherwise) involved training with a four-key choice procedure. Each pigeon
was trained to discriminate among line drawings of four different objects, such
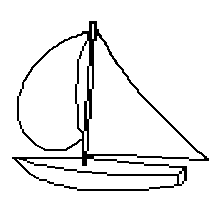
as a watering can, an iron, a desk lamp, and a sailboat. The training objects
were displayed individually in the center of a video monitor on different
trials.  The pigeon had to initially peck at the object on the viewing screen in order to
obtain access to four differently-colored choice keys. The choice keys were
situated diagonally from each corner of the viewing screen. Each object was
associated with a different choice key. For example, one pigeon might have to
peck the red key in the presence of the watering can, the green key in the
presence of the iron, the blue key in the presence of the desk lamp, and the
violet key in the presence of the sailboat. Different birds recieved different
object-choice key assignments. If the pigeon pecked the correct choice key, then
food reinforcement was delivered to a food tray located on the back wall of the
chamber. If the pigeon chose the incorrect key, then the trial was repeated
until a correct choice was made, resulting in the delivery of food. Training
sessions were conducted daily until the birds attained a high level of accuracy
(e.g., 75% correct to each object).
Testing Procedure. Testing with different kinds of stimulus manipulations occurred following training on the original task. Test stimuli were presented in sessions along with normal training trials and their occurrence was relatively rare (e.g., 16% of the trials). On training trials, the normal contingencies were in place (correction trials for an incorrect response and food reward for a correct response). On test trials, food reinforcement was delivered, regardless of the pigeon's initial choice response. If performance on the training trials fell below a criterion (e.g., 75% correct on each key), then one or more retraining sessions were administered to re-establish accurate performance on the original discrimination
![]()
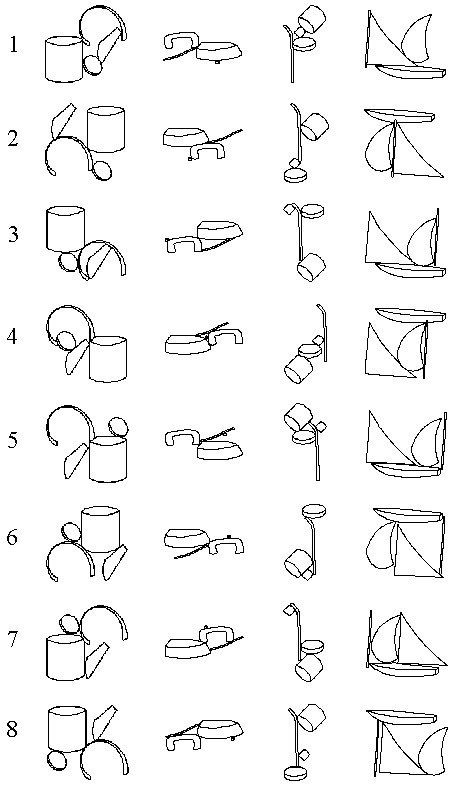
The eight scrambled versions of the watering can, iron, desk lamp, and sailboat. Each scrambled version was created by changing the relative location of the four components constituting an object. The only constraint was that the height and width of the scrambled object had to match the dimensions of the intact objects. Different scrambled versions were used in different experiments as listed below.
![]()
![]()
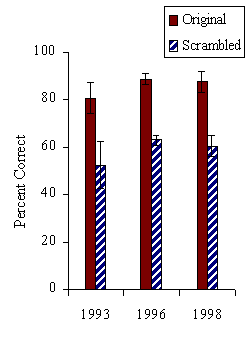
Results of three different experiments testing with scrambled versions of the watering can, the iron, the desk lamp, and the sailboat (Wasserman et al., 1993; Kirkpatrick-Steger, Wasserman, Biederman, 1996, 1998).
![]()
Test stimuli designed to test the contribution of the geon intersections to picture recognition. The four components constituting the original training objects (the watering can, iron, desk lamp, and sailboat) were disconnected so that they no longer touched one another. The operation of disconnection removed the geon intersections, but left the relations among the geons relatively intact. The effect of disconnecting geons was assessed with scrambled versions of the objects as well. If the intersections were important for recognition of the original objects, then the effect of disconnection should be similar to the effect of scrambling object components.

![]()
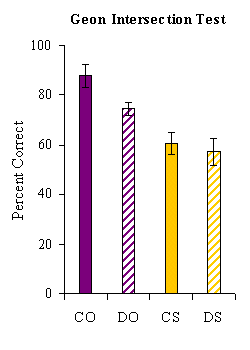
Results from the geon intersection test. Disconnection of the geons in the original spatial organization (DO) resulted in accuracy scores that did not differ from the original objects (CO). The connected-scrambled (CS) and disconnected-scrambled (DS) drawings were discriminated at a similar level of accuracy, which was significantly poorer than the original drawings.
![]()
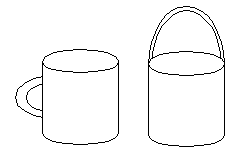
If pigeons recognize objects using local features alone, then variations in the arrangement of those features would have little or no impact on the accuracy of recognition. Thus, unlike humans, the pigeon would be incapable of discriminating between the cup and the pail. The cup and the pail are comprised of two components: a cylinder and a curved handle. However, the orientation and position of the handle relative to the cylinder
![]()
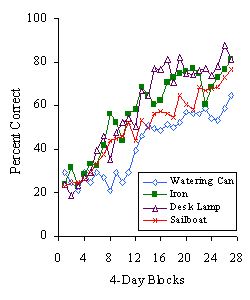
Learning results for tests involving the discrimination of the scrambled objects. All four pigeons learned to discriminate among the four scrambled versions of an object. The degree of accuracy at the end of training (mean of four pigeons = 75.9% correct) was similar to accuracy levels obtained with pigeons that were trained to discriminate among the intact training objects (mean of four pigeons = 80.5% correct).
![]()
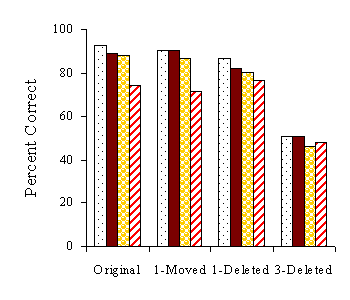
Results from the geon deletion test. All four pigeons (different bars) continued to discriminate the original drawings at a high level of accuracy. When a single geon was either moved or deleted, there was no apparent effect on recognition accuracy. In contrast, deleting three geons produced a significant disruption in accuracy scores, but performance was still above the chance level of 25%.
![]()
The figure below shows the percentage of total pecks that occurred to the S- stimuli containing either the correct shape or the correct location. Substantial generalization occurred along both the shape and locations dimensions. Six of the eight birds demonstrated greater generalization to common location than to common shape; one bird that exhibited stronger control by shape (handle-below S+), and one bird exhibited approximately equal control by shape and location (handle-below S+).
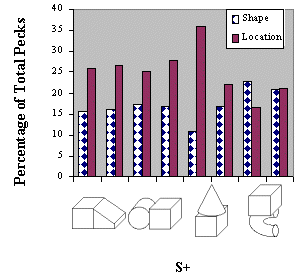
![]()
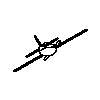
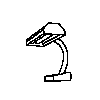
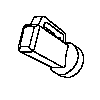
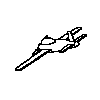
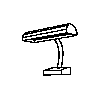
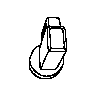
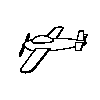
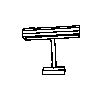
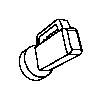
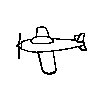
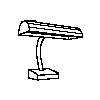
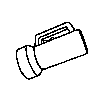
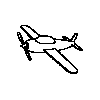
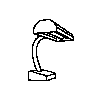
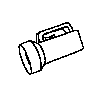
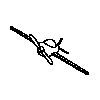
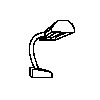
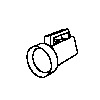
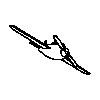
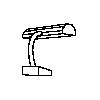
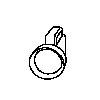
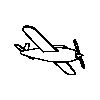
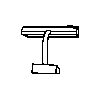
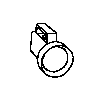
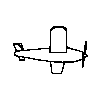
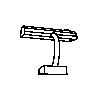
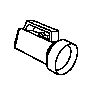
The set of orientations used in training and testing phases of the viewpoint invariance studies.
| Rotation | Chair | Plane | Lamp | Flashlight |
| -100° | 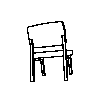 |
 |
 |
 |
| -67° | 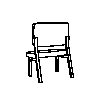 |
 |
 |
 |
| -33° | 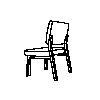 |
 |
 |
 |
| 0° | 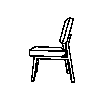 |
 |
 |
 |
| 33° | 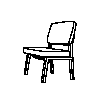 |
 |
 |
 |
| 67° | 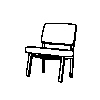 |
 |
 |
 |
| 100° | 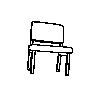 |
 |
 |
 |
| 133° | 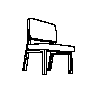 |
 |
 |
 |
| 167° | 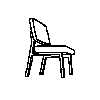 |
 |
 |
 |
![]()
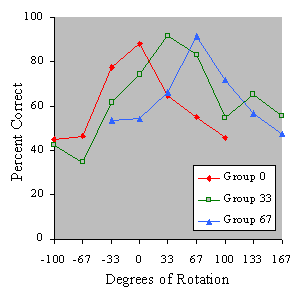
Results from tests with novel orientations. All three groups produced generalization gradients to the novel orientations. Choice accuracies were highest for the original training stimuli. There was a fairly symmetrical generalization decrement on either side of the training stimulus, but even the most extreme orientations were recognized above the chance level of 25% in all three groups.
![]()
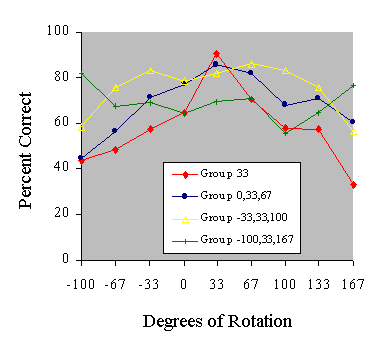
Group 33 produced a generalization gradient that was similar in shape to the gradients obtained in the first experiment. Discrimination performance was maximal at the training orientation of 33° and then fell off on either side as the objects were rotated farther from the original viewpoint. All of the orientations were recognized above the chance level of 25%. The other three groups of birds demonstrated a much flatter generalization gradient than group 33. The degree to which the gradient was broadened was related to the spacing of the training orientations, with the most widely spaced training orientations (group -100,33,167) resulting in the flattest generalization gradient.
![]()
Training Locations: The four locations in which line drawings were presented: upper-center, lower-center, left-center, and right center. All four training objects (watering can, iron, desk lamp, and sailboat) were displayed in each of the four locations equally often.

![]()
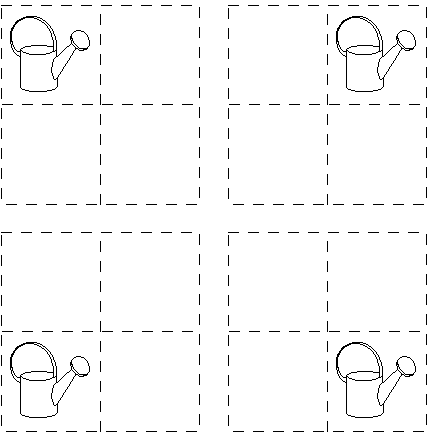
Novel Testing Locations: The four locations in which line drawings were presented during testing: upper-left, upper-right, lower-left, and lower-right. All four objects drawings (watering can, iron, desk lamp, and sailboat) were displayed multiple times in each of the four locations.
![]()
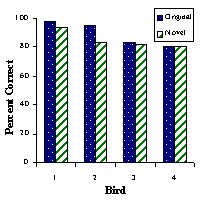
Accuracy scores for the original and novel viewing locations for each of the four birds. There was no noticeable effect of moving the entire object to a new location on the viewing screen (M = 85% correct), compared to presenting the object in its normal location (M = 89% correct). The successful generalization to novel locations indicates that the pigeon's recognition of line drawings of objects is translationally invariant, much like visual perception in humans.
| 25% | 50% | 75% | 100% | 150% | 200% | 250% |
 |
 |
 |
 |
 |
 |
|
 |
 |
 |
 |
 |
 |
|
 |
 |
 |
 |
 |
 |
|
 |
 |
 |
 |
 |
 |
![]()
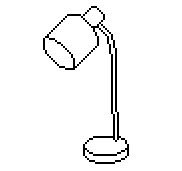
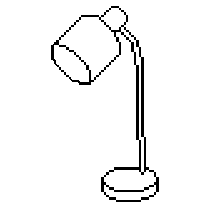
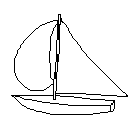
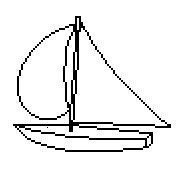
Dimensions for the test sizes of the Watering Can, Iron, Desk Lamp, and Sailboat. For each size, there is a height, width, and area. The maximum dimension (height or width), denoted in italics, was the same for all four objects at each size.
| Watering Can | 25% | 50% | 75% | 100% | 150% | 200% | 250% |
| Height (cm) | 0.67 | 1.31 | 1.98 | 2.68 | 4.02 | 5.36 | 6.70 |
| Width (cm) | 0.71 | 1.38 | 2.08 | 2.79 | 4.16 | 5.57 | 6.95 |
| Area (cm2) | 0.47 | 1.85 | 4.12 | 7.47 | 17.00 | 29.86 | 46.57 |
| Iron | |||||||
| Height (cm) | 0.28 | 0.56 | 0.81 | 1.09 | 1.62 | 2.19 | 2.72 |
| Width (cm) | 0.71 | 1.38 | 2.08 | 2.79 | 4.16 | 5.57 | 6.95 |
| Area (cm2) | 0.20 | 0.78 | 1.69 | 3.05 | 6.76 | 12.19 | 18.88 |
| Desk Lamp | |||||||
| Height (cm) | 0.71 | 1.38 | 2.08 | 2.79 | 4.16 | 5.57 | 6.95 |
| Width (cm) | 0.39 | 0.78 | 1.13 | 1.52 | 2.33 | 3.03 | 3.81 |
| Area (cm2) | 0.27 | 1.07 | 2.35 | 4.23 | 9.69 | 16.91 | 26.48 |
| Sailboat | |||||||
| Height (cm) | 0.64 | 1.20 | 1.76 | 2.40 | 3.60 | 4.80 | 6.00 |
| Width (cm) | 0.71 | 1.38 | 2.08 | 2.79 | 4.16 | 5.57 | 6.95 |
| Area (cm2) | 0.45 | 1.65 | 3.67 | 6.69 | 14.98 | 26.74 | 41.70 |
![]()
This figure displays recognition accuracy, in percent correct, as a function of relative image size. Relative image size is scaled logarithmically to equate the sizes in relative distance units. Performance was best to the original training size, but there was substantial generalization to both smaller and larger sizes. All of the images but the smallest size were recognized above chance. The generalization gradient was somewhat asymmetrical: the decrement in performance was more modest to larger sizes than to smaller sizes.