Entire Set of Printable Figures For
Chunking & Serially Organized Behavior in Pigeons, Monkeys, and Humans - Terrace
![]()
Figure 1. Average number of sessions needed by pigeons to satisfy accuracy criterion during successive phases of training on a 4-item list. See Straub and Terrace (1981) for further details.
![]()
Figure 2. Proportion
of trials completed correctly on each 2-item subset that can be derived from the
list A![]() B
B![]() C
C![]() D.
See Straub and Terrace (1981) for further details.
D.
See Straub and Terrace (1981) for further details.
![]()
Figure 3. Average latency of responding to each item during 2-item subset tests. See Straub and Terrace (1981) for further details.
![]()
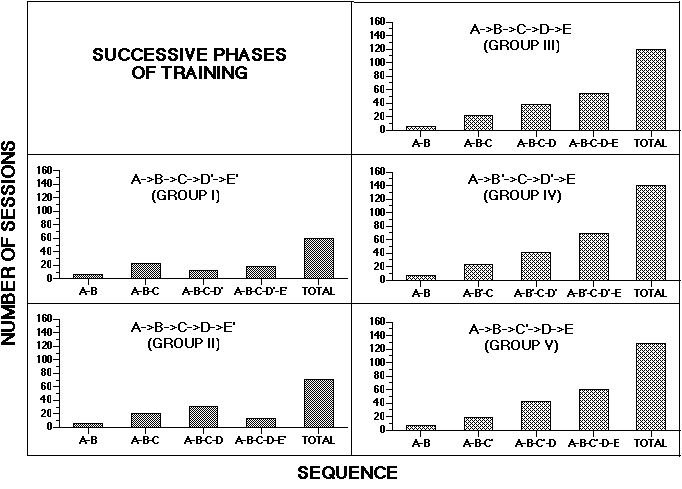
Figure 4. Average number of sessions needed to satisfy accuracy criterion during each phase of training and during all sessions for chunking (left-hand panels) and non-chunking groups (right-hand panels). See Terrace (1987) for additional details.
![]()
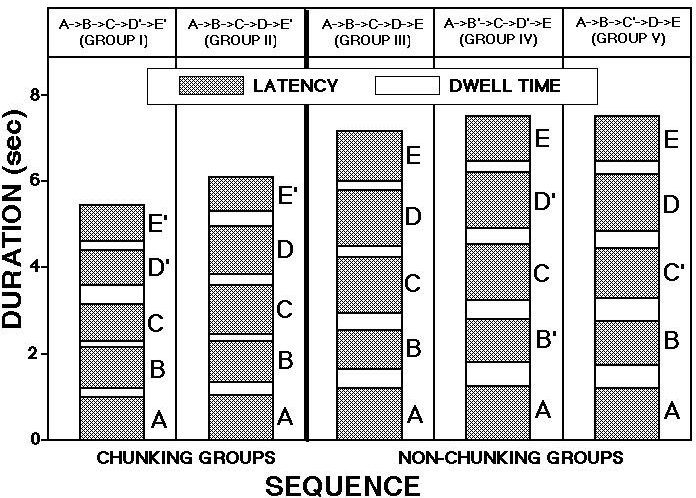
Figure 5. Average duration of each correctly completed sequence for each of the chunking and non-chunking groups. See Terrace and Chen (1991a) for additional details.
![]()
Figure 6. Average dwell time for each of the chunking and non-chunking groups. See Terrace and Chen (1991a) for additional details.
![]()
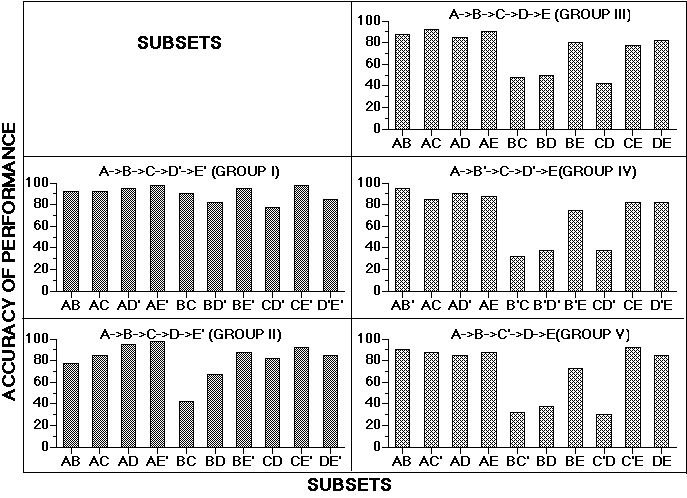
Figure 7. Proportion of trials completed correctly to each of the ten 2-item subsets that can be derived from 5-item lists. Chunking groups are on the left; non-chunking groups on the right. See Terrace and Chen (1991a) for additional details.
![]()
Figure 8. Average percentage of correct responses to each of the ten 2-item subsets that can be derived from 5-item lists by monkeys (D'Amato and Colombo, 1988) and pigeons (Terrace, 1987).
![]()
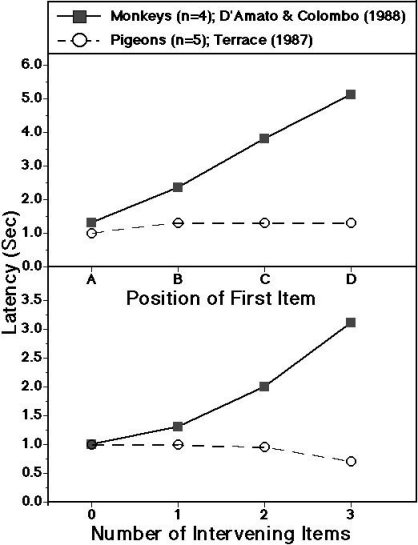
Figure 9. Latency
of response to first and second items of subsets.
The top panel shows the mean latency of responding (in seconds) to the
first item of two-item test pairs as a function of that item's position on the
original list (A![]() B
B![]() C
C![]() D
D![]() E).
The bottom panel shows the mean latency of responding to the second item
of two-item subset pairs as a function of the number of items that intervened
between those items on the original list. Filled
squares show data from monkeys (D'Amato and Colombo, 1988); open triangles, data
from pigeons (Terrace, 1987).
E).
The bottom panel shows the mean latency of responding to the second item
of two-item subset pairs as a function of the number of items that intervened
between those items on the original list. Filled
squares show data from monkeys (D'Amato and Colombo, 1988); open triangles, data
from pigeons (Terrace, 1987).
![]()
Figure 10. Learning curves for 3-, 4- and 7-item lists trained in experiment by Terrace et al. (2000). Panels A & B. Each panel shows the percentage of correctly completed trials during the first and the last (lower and upper functions, respectively) sessions of training on 3-item lists (A) and 4-item lists (B). The dashed lines show the best-fit linear models. Panel C. Each function shows the mean accuracy of responding on each 7-item list during even-numbered sessions. Note that the abscissa in Panel C is Session (not List).
![]()
Figure 11. Composition of original and derived lists used in experiment by Chen, et al. (1997).
![]()
Figure 12. Number of trials needed to satisfy the accuracy criterion on four derived lists and on two novel lists. The novel lists were the last lists learned by Rutherford and Franklin prior to this experiment (Swartz et al., 1991). See Figure 10 for the order in which the derived lists were trained.
![]()
Figure 13. Average latency of responding
by monkeys to each item on four 6-item lists. See text for
additional details.
![]()
Figure 14. Stimuli used to construct 8-item lists for human subjects trained by the simultaneous chaining paradigm. See text for additional details.
![]()
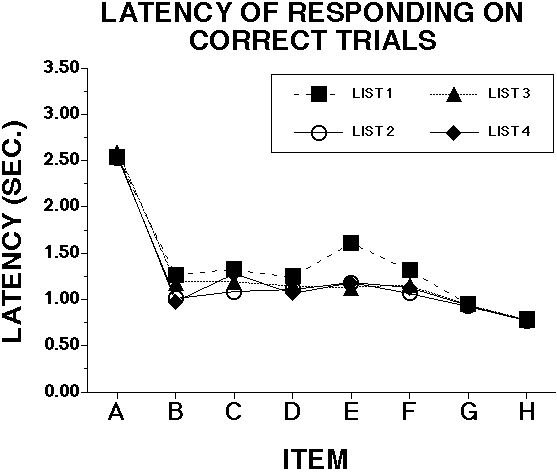
Figure 15. Average latency of responding by human subjects to each item on four 8-item lists. See text for additional details.
![]()
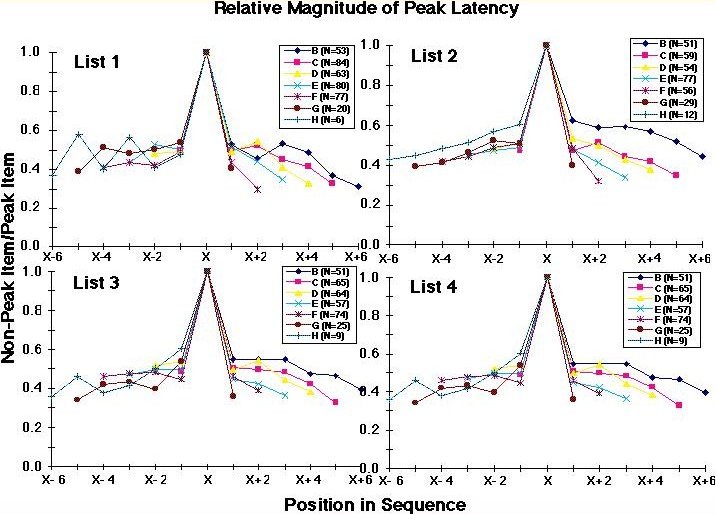
Figure 16. Relative magnitude the longest IRT of human subjects at each position of four 8-item lists. For each trial, the IRT's at each position were divided by the longest latency on that trial (excluding the latency to A). The longest latency is represented as X, and the other items correspond to their ordinal distance from X (X-6 to X+6). The range of the number of correct trials used to calculate each of the data points for positions B-G was 20-84; for position H, 6-17. See text for additional details.
![]()
Figure 17. Relative magnitude of the longest IRT of Bugs (rhesus macaque) at each position on four 6-item lists. For each trial, the IRT's at each position were divided by the longest latency on that trial (excluding the latency to A). The longest latency is represented as X, and the other items correspond to their ordinal distance from X (X-4 to X+4). The range of the number of correct trials used to calculate each of the data points for positions B-E was 6-30; for position F, 2-10. See text for additional details.
![]()
Figure 18. Relative magnitude of the longest IRT of Garbo (rhesus macaque) at each position on four 6-item lists. For each trial, the IRT's at each position were divided by the longest latency on that trial (excluding the latency to A). The longest latency is represented as X, and the other items correspond to their ordinal distance from X (X-4 to X+4). The range of the number of correct trials used to calculate each of the data points for positions B-F was 6-34. See text for additional details.