
Entire Set of Printable Figures For
Learning Strategies in Matching to Sample - Wright
![]()
Demo can't be printed.
![]()
152 Stimuli won't be printed.
![]()
Demo can't be printed.
![]()
Demo can't be printed.
![]()
Figure
1.
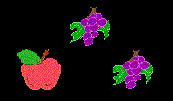
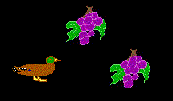
The 12 displays used in the matching-to-sample task divided into two
counterbalanced sets shown in the
upper and lower portions of the figure. Each set was used equally often as
training and a testing set. The
center (apex) cartoon of each display is the sample stimulus, and side cartoons
are the comparison stimuli.


![]()
Demo can't be printed.
![]()
Figure 2. Acquisition functions for individual subjects in each of the
four groups of Experiment A. The groups are labeled according to their
fixed-ratio sample requirement, for example, pigeons in the FR20 group were
required to peck the sample 20 times before the comparison stimuli were
presented. Pigeons in the FR0 group were not required to peck the sample; all
three cartoons of the display were presented at the same time. Within each
group, pigeons trained on the upper set of Figure 1 have their data shown with
unfilled points and those trained on the lower set of Figure 1 have their data
shown with filled points.

![]()
Figure 3. Acquisition functions for the individual subjects in each of
the four groups of Experiment B. The groups are labeled according to their
fixed-ratio sample requirement, for example, pigeons in the FR20 group were
required to peck the sample 20 times before the comparison stimuli were
presented. Pigeons in the FR0 group were not required to peck the sample; all
three cartoons of the display were presented at the same time. Within each
group, pigeons trained on the upper set of Figure 1 have their data shown with
unfilled points and those trained on the lower set of Figure 1 have their data
shown with filled points.

![]()
Figure 4. Mean acquisition functions from Experiment A (upper panel)
and Experiment B (lower panel) as a function of the number of training trials.

![]()
Figure 5. Comparison of mean acquisition functions from Experiments A
and B for the four groups with different sample response requirements.

![]()
Figure 6. Baseline (training) and transfer performance for the four groups in Experiment A (upper panel) and Experiment B (lower panel). Baseline is performance with the training displays during transfer. Transfer to testing displays is performance with the six displays (see Figure 1) not used in training. Transfer to novel-stimuli displays is performance with displays composed of novel stimuli. Error bars are the standard error of the mean.

![]()
Figure 7. Acquisition and transfer by two pigeons trained and tested
with an FR40 sample response requirement. Baseline is performance with the
training displays during transfer. Transfer to testing displays is performance
with the six displays not used in training. Transfer to novel-stimuli displays
is performance with displays composed of novel stimuli.
