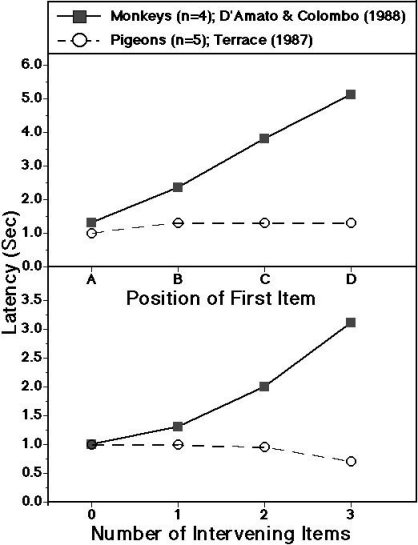
Figure 9. Latency of response to first and second items of
subsets. The top
panel shows the mean latency of responding (in seconds) to the
first item of two-item test pairs as a function of that item's
position on the original list (A B C D E).
The bottom panel shows the mean latency of responding to
the second item of two-item subset pairs as a function of the
number of items that intervened between those items on the
original list. Filled
squares show data from monkeys (D'Amato and Colombo, 1988); open
circles are data from pigeons (Terrace, 1987). |