![]()
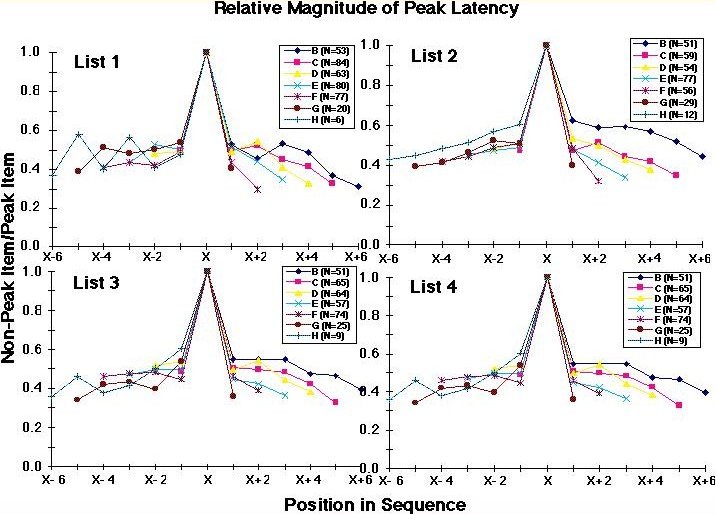
Figure 16. Relative magnitude the longest IRT of human subjects at each position of four 8-item lists. For each trial, the IRT's at each position were divided by the longest latency on that trial (excluding the latency to A). The longest latency is represented as X, and the other items correspond to their ordinal distance from X (X-6 to X+6). The range of the number of correct trials used to calculate each of the data points for positions B-G was 20-84; for position H, 6-17. See text for additional details.