Control by a Square Pattern
Brown and Terrinoni (1996) reported the first evidence for
control by a spatial pattern of baited poles. In a 4 X 4 pole box, one of
nine possible 2 X 2 square arrangements of four baited poles was available on
each daily trial. The figure below illustrates the critical fact that,
over trials, the identity of the baited poles was unpredictable prior to each
trial, but the baited poles were consistently arranged in the square pattern.
Figure C-1:
The pattern exemplar changes unpredictably from trial to trial.
The video below shows a typical trial in the 4 X 4 pole box apparatus,
after some exposure to a square pattern. The baited poles during this
sample trial are indicated by the red rings (superimposed on the video for
illustration purposes)
![]()
Figure C-2: Video example of pole box trial.
Click Image to Play
As this sample trial suggests, rats come to be controlled to some extent by the
consistent spatial arrangement of the baited poles. Prior to each, the
location of the baited poles is unpredictable unless, of course, the rats can
perceptually detect them - using odor cues, for example. We have
consistently found in all of our pole box experiment that, in fact, the rats are
no more likely to choose a baited pole than would be expected on the basis of
chance. Thus, the rats are not locating the baited poles using odor
or any other perceptual cues.
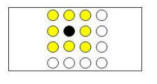
If a rat learned that the baited poles are arranged in a 2 X 2 square pattern,
then the discovery of one or more baited poles might be expected to provide
information about the location of the remaining baited poles. In
particular, after the discovery of one baited pole (indicated by the black
circle in Figure C-3 Top Panel), the square pattern indicates that the remaining
three baited poles must be among the eight nearby poles (indicated by the yellow
circles).
|
 |
|
 |
|
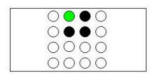 |
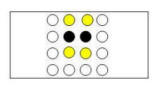
Figure C-3: Logic of control by a square pattern. Black circles
represent discovered baited poles. Yellow circles represent
poles that may be baited, given location of discovered baited poles.
Green circles represent poles that must be baited, given location of
discovered baited poles.
|
After the discovery of two adjacent baited poles (Figure C-3,
Middle Panel), the square pattern indicates that the
remaining two baited poles must be one of two adjacent pairs of poles (indicated
by the yellow circles). And after three baited poles have been discovered (Figure
C-3, Bottom Panel), the the location
of the one remaining baited pole is completely determined.
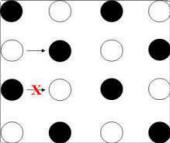
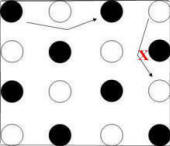
The clearest evidence for behavioral control by the square
pattern comes from an analysis of the choices that immediately follow the
discovery of the second and third baited poles. Following the second
discovery of the baited pole (marked "2" in Figure C-4), is the rat
relatively more likely to next choose a pole that conforms to the pattern (i.e.,
the two poles marked "S")? An accurate assessment of
such control by the pattern requires that two other factors affecting pole
choices be considered. First, there is a strong tendency to choose poles
that are spatially proximal to the most recently chosen pole. Thus, the
analysis compares choice of poles that conform to the pattern ("S" poles in the
figure) to choice of poles that are also adjacent to the most recent choice but
do not conform to the pattern (the "X" pole in the figure). Also, rats may
have a tendency to avoid revisits to poles chosen earlier in the trial, just as
they avoid revisits to maze arms in a radial-arm maze (Olton & Samuelson, 1976).
In fact, it is clear that rats are able to avoid pole revisits in the pole box
task, albeit to a much less extent than they avoid revisits of maze arms in the
radial-arm maze. To control for any possible confounding of control by the
pattern with control by previous pole visits, only initial visits to poles are
included in the analysis (i.e., revisits of poles are not included in the
analysis).
 |
Figure C-4:
Logic of the Brown and Terrinoni analysis of choice conformity to
the square pattern follow discovery of a second baited pole. 1
= first baited pole chosen during trial; 2 = second baited pole
chosen during a trial; S = poles adjacent to the second baited pole
chosen that conform to the square pattern; X = poles adjacent to the
second baited pole that do not conform to the square pattern.
Green arrows show conforming moves and red arrows show
non-conforming moves. The analysis compares the proportion of
moves conforming to the pattern to the proportion expected on the
basis of chance, based on these values for each rat cumulated over
trials. |
Figure C-5 shows the results of this analysis in the
experiment reported by Brown and Terrinioni (1996) in which rats were exposed to
a square pattern for 120 daily trials. The empirical results, shown
in blue, are in terms of the proportion of choices made immediately
following the discovery of a second baited pole and to a previously unvisited
and spatially adjacent pole which were to a pole consistent with the square
pattern (i.e., choices to poles represented by the "S" poles in Figure
C-4). These data can be compared to the proportion that would be
expected on the basis of chance, shown in red. This proportion is
given by the proportion of previously unvisited and spatially adjacent poles
that were consistent with the pattern.
So, in the example trial above, the Proportion Expected is:
2 ("S" poles) / 3 ("S" poles + "X" poles, assuming that none of them have been
previously visited during the trial) = .67
Note that the expected proportion is affected by the number of adjacent poles
that have been previously visited during the trial and by the location of the
square exemplar on any given trial (i.e., whether the square is in the center,
edge, or corner of the pole box matrix). The proportions obtained and
expected were calculated for each rat during each trial block. The rats
choose poles that were consistent with the square pattern more often than
expected by chance, and this difference increased over the three trial blocks.
 |
Figure C-5:
The proportion of choices following discovery of a second baited
pole that conformed to the square pattern was greater than the
proportion expected on the basis of chance. The difference
between empirical and expected performance increased over trial
blocks. |
Choices following the third discovery of a baited pole were
analyzed separately in a directly analogous manner. Figure C-6 shows
an example of the possibilities for choices included in the analysis following
discovery of the third baited pole. In this case, there is always exactly
one pole consistent with the pattern (i.e., the remaining baited pole) and up to
two choices that would be inconsistent with the pattern.
 |
Figure C-6:
Logic of the Brown and Terrinoni analysis of choice conformity to
the square pattern follow discovery of a third baited pole. 1
= first baited pole chosen during trial; 2 = second baited pole
chosen during a trial; 3 = third baited pole chosen during a trials;
S = poles adjacent to the third baited pole chosen that conform to
the square pattern; X = poles adjacent to the third baited pole that
do not conform to the square pattern. Green arrows show
conforming moves and red arrows show non-conforming moves. The
analysis compares the proportion of moves conforming to the pattern
to the proportion expected on the basis of chance, based on these
values for each rat cumulated over trials. |
The obtained and expect proportions of choices made that were
consistent with the pattern in Brown and Terrinoni's experiment are shown in
Figure C-7.
Again, rats choose poles consistent with the square pattern more often than
would be expected on the basis of chance and the tendency to do so increased
over the course of the experiment.
 |
Figure C-7:
The proportion of choices following discovery of a third baited pole
that conformed to the square pattern was greater than the proportion
expected on the basis of chance. The difference between
empirical and expected performance increased over trial blocks. |
We have replicated Brown and Terrinoni's evidence that choices
come to be controlled by a square pattern of baited poles several times (Brown,
Yang, & DiGian, 2002; DiGian, 2002; Lebowitz & Brown, 1999; Wintersteen,
2003).
One important detail in all of these experiments is that we use
several methodological and analytic techniques to be sure that choice of baited
poles can not be explained by any perceivable cue. The most obvious
possibility is that the rats can use odor to locate baited poles. In
all of our recent experiments, we use poles that include a "sham" bait pellet.
The structure of these poles is shown in Figure C-8. Each pole
is constructed with an inner core of dowel. A single "sham" pellet is
hidden in a well drilled in the top of the pole. The core is covered by a
sleeve made of PVC (removed from the core for purposes of this illustration).
The top of the sleeve includes a well in which a single pellet can be hidden
when the pole is baited. The floor of well is nylon mesh material.
Thus, any odor from the 45 mg sucrose pellets is present in every pole.
However, only the baited poles contain a pellet that is accessible to the rat.
The second means of determining whether odor or any other other perceptual cues
play a role in locating the baited poles is to examine rats' ability to locate
the first baited pole discovered during each trial. Because the location
of the baited poles varies unpredictably from trial to trial, the ability to
locate the baited poles should be no more accurate than expected on the basis of
chance - unless the rats can detect the pellets perceptually. We have
examined this aspect of performance in each of the experiments we have done
using the pole box apparatus. We have not found any evidence that rats
locate the first baited pole any better than would be expected on the basis of
chance (see Lebowitz & Brown, 1999) for a discussion of some of the complexities
involved in this measure.
Thus, the ability of rats to locate additional baited poles
after discovering the location of one baited pole must be based on learning the
pattern.
|
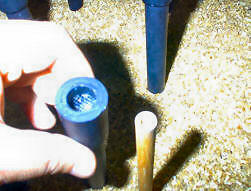 |
Figure C-8:
Outer sleeve of pole (being held) and inner core (to right).
Sham pellet (on every pole) is placed in well at top of inner core.
Baited poles have a second (accessible) pellet in the well at top of
sleeve. |
Control by a Linear Pattern
In several experiments, we have shown that choices can also be
controlled by a linear pattern of baited poles. In some of these
experiments, the baited poles form either one row or one column of the
pole matrix (Brown & Terrinoni, 1996; Brown, DiGello, Milewski, Wilson, & Kozak,
2000). In others, the baited poles form a linear pattern with the same
orientation on every trial, but a different row of the matrix (DiGello, Brown, &
Affuso, 2002; DiGian, 2002). This latter version of a linear pattern is
illustrated in Figure C-9.
Figure C-9: Several exemplars of the Row pattern.
The video in Figure C-10 shows a trial in the experiment of DiGello, et
al. (2002). One of the four rows of poles
is baited on each trial. The baited poles on this sample trial are
the four poles in the row adjacent to the wall of the pole box that cuts across
the lower right corner of video (indicated by the green arrows superimposed on
the video). Those four poles are baited on 25%
of the trials, with each of the three parallel rows of poles also being baited on 25%
of the trials.
![]()
Figure C-10: Video of trial in experiment using the row pattern.
The poles baited on this example trial are indicated by the
green arrows.
Click Image to Play
Two features of the Line Pattern are particularly interesting
for our understanding of pattern learning. First, an alternative
explanation for control by the square pattern involves spatial gradients of
generalized excitation surrounding baited poles that have been discovered.
That is, when a rat finds a baited pole, perhaps the area surrounding the pole
increases in attractiveness - a form of generalization. Figure C-11
illustrates how two overlapping gradients of excitation (represented by the
green areas) centered on two
previously discovered baited poles can result in more generalized excitation to
poles that are consistent with the square pattern (i.e., the poles above and
below the previously discovered baited poles) than to adjacent poles not
consistent with the pattern (i.e., the pole to the right of the 2nd discovered
pole). Thus, control by the square pattern could be explained by
generalization.
A line pattern, however, requires that rats make choices that
are inconsistent with generalization. Thus, control by the line pattern rules out a general explanation of control by spatial patterns in terms of
generalization.
 |
Figure C-11:
Explanation for control by a square pattern in terms of overlap of
spatial generalization gradients around the previously discovered
poles. In the this case the gradients produced by two baited
poles discovered earlier in the trial overlap at the location of
poles that conform to the square pattern, but not at the location of
poles that do not. |
The second important feature of the the row pattern is
the fact that locating an unbaited pole (as well as locating a baited pole)
provides potential information - if one pole in a row is not baited, then none
of the poles in that row are baited. We have
shown that rats' choices are controlled by this contingency (DiGello, Brown, &
Affuso, 2002).
DiGello, et al. tested rats in a 4 X 4 pole box in
which one of four columns of poles was baited on each trial, as in the
video in Figure C-10. If a rat has discovered one or more baited poles (e.g., the pole
indicated in black in Figure C-12), then the remaining baited poles are determined - they
are the other poles in the same column (e.g., the poles indicated in yellow).
 |
Figure C-12:
Positive information provided by choice of a baited pole when a
column pattern is in force. When a baited pole is chosen
(black circle), the remaining baited poles (yellow) are in the same
column. |
If a rat chooses a pole and that pole is not baited (e.g., the pole
indicated in green in Figure C-13), then none of the remaining three poles in that column
are baited, and the baited poles are in one of the three remaining columns.
Thus, although determining that a pole is not baited does not provide as much
information as discovering a baited pole, it does narrow down the possibilities. DiGello, et al. (2002) showed that rats come to be controlled by both sources of
information. They acquire both a tendency to choose poles in the same
column after choosing a baited pole and a tendency to choose poles in a
different column after choosing an unbaited pole.
 |
Figure C-13:
Negative information provided by discovery of an unbaited pole when
a column pattern is in force. When an unbaited pole is chosen
(green circle), the remaining poles in that column are not baited
(unfilled circles) and the baited poles are in one of the three
other columns (yellow, orange, or red). |
Control by a Checkerboard Pattern
A third spatial pattern that we have studied is the checkerboard pattern. This
pattern has only two exemplars, as illustrated in Figure C-14.
Figure C-14:
The two exemplars of a checkerboard pattern.
Our analysis of control by the checkerboard pattern involves consideration of
the relative probability of three kinds of "moves" (transitions from one choice
to the next). The first is choice of a pole adjacent to the pole most
recently chosen. In Figure C-15 (Top Panel), filled circles represent
baited poles and the arrows indicate two examples of an adjacent move. An
"adjacent" move is consistent with the checkerboard pattern following choice of
an unbaited pole (i.e., an adjacent move following choice of an unbaited pole
would result in choice of a baited pole). However, an adjacent move
following choice of a baited pole would result in choice of an unbaited pole.
|
 |
|
 |
|
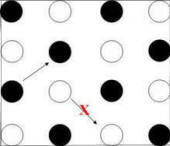 |
Figure C-15: Logic of control by a square pattern. Black circles
represent discovered baited poles. Yellow circles represent
poles that may be baited, given location of discovered baited poles.
Green circles represent poles that must be baited, given location of
discovered baited poles.
|
A "skip" move is choice of pole separated by one pole (in either a row or column
of the pole matrix) from the most recently chosen pole. As shown in Figure
C-15 (Middle Panel), a skip move is consistent with the checkerboard pattern (i.e., would
result in choice of a baited pole) following choice of a baited pole, but not
following choice of an unbaited pole.
Finally, a "diagonal" move is choice of a pole that is adjacent along a diagonal
axis to the most recently chosen pole. As shown in Figure C-15 (Bottom
Panel), a diagonal
move (like a skip move) is consistent with the checkerboard pattern following
choice of a baited pole, but not following choice of an unbaited pole.
Brown, Zeiler, & John (2001) found that rats acquire a tendency
to make adjacent moves following choice of an unbaited pole and skip & diagonal
moves following choice of a baited pole. Figure C-16 shows their data
in an experiment with 60 daily trials. Over the course of three blocks of
20 trials each, the relative likelihood of adjacent moves increases following
choice of an unbaited pole and decreases following choice of a baited pole.
The opposite chance occurs for skip moves and diagonal moves. Thus, rats
acquire tendencies to make choices that conform to the checkerboard pattern in
which baited poles are arranged. This evidence for control by a
checkerboard pattern was replicated by Brown and Wintersteen (2004).
|
|
Figure C-16:
Results from Brown, Zeiler, & John (2001). By Trial Block 3,
Adjacent moves were more likely following choices of an unbaited
pole, whereas Skip and Diagonal moves were more likely following
choice of a baited pole. These results provide evidence of
control by the checkerboard spatial pattern. |
These results show that rats can learn a variety of spatial
patterns. It should again be emphasized that these are not spatial
relations among particular places defined by their location in allocentric
space. The location of food chances unpredictably from trial to trial.
Thus, the spatial relations among the baited locations must be abstracted from
any allocentric map that is anchors by specific locations in space. We
infer that an abstract representation of the spatial pattern is formed as the
rat experiences that spatial relations that exist among places where food has
been found within each trial. The next part
explores some of mechanisms that might be involved in this ability.